Insights and Observations
Economic, Public Policy, and Fed Developments
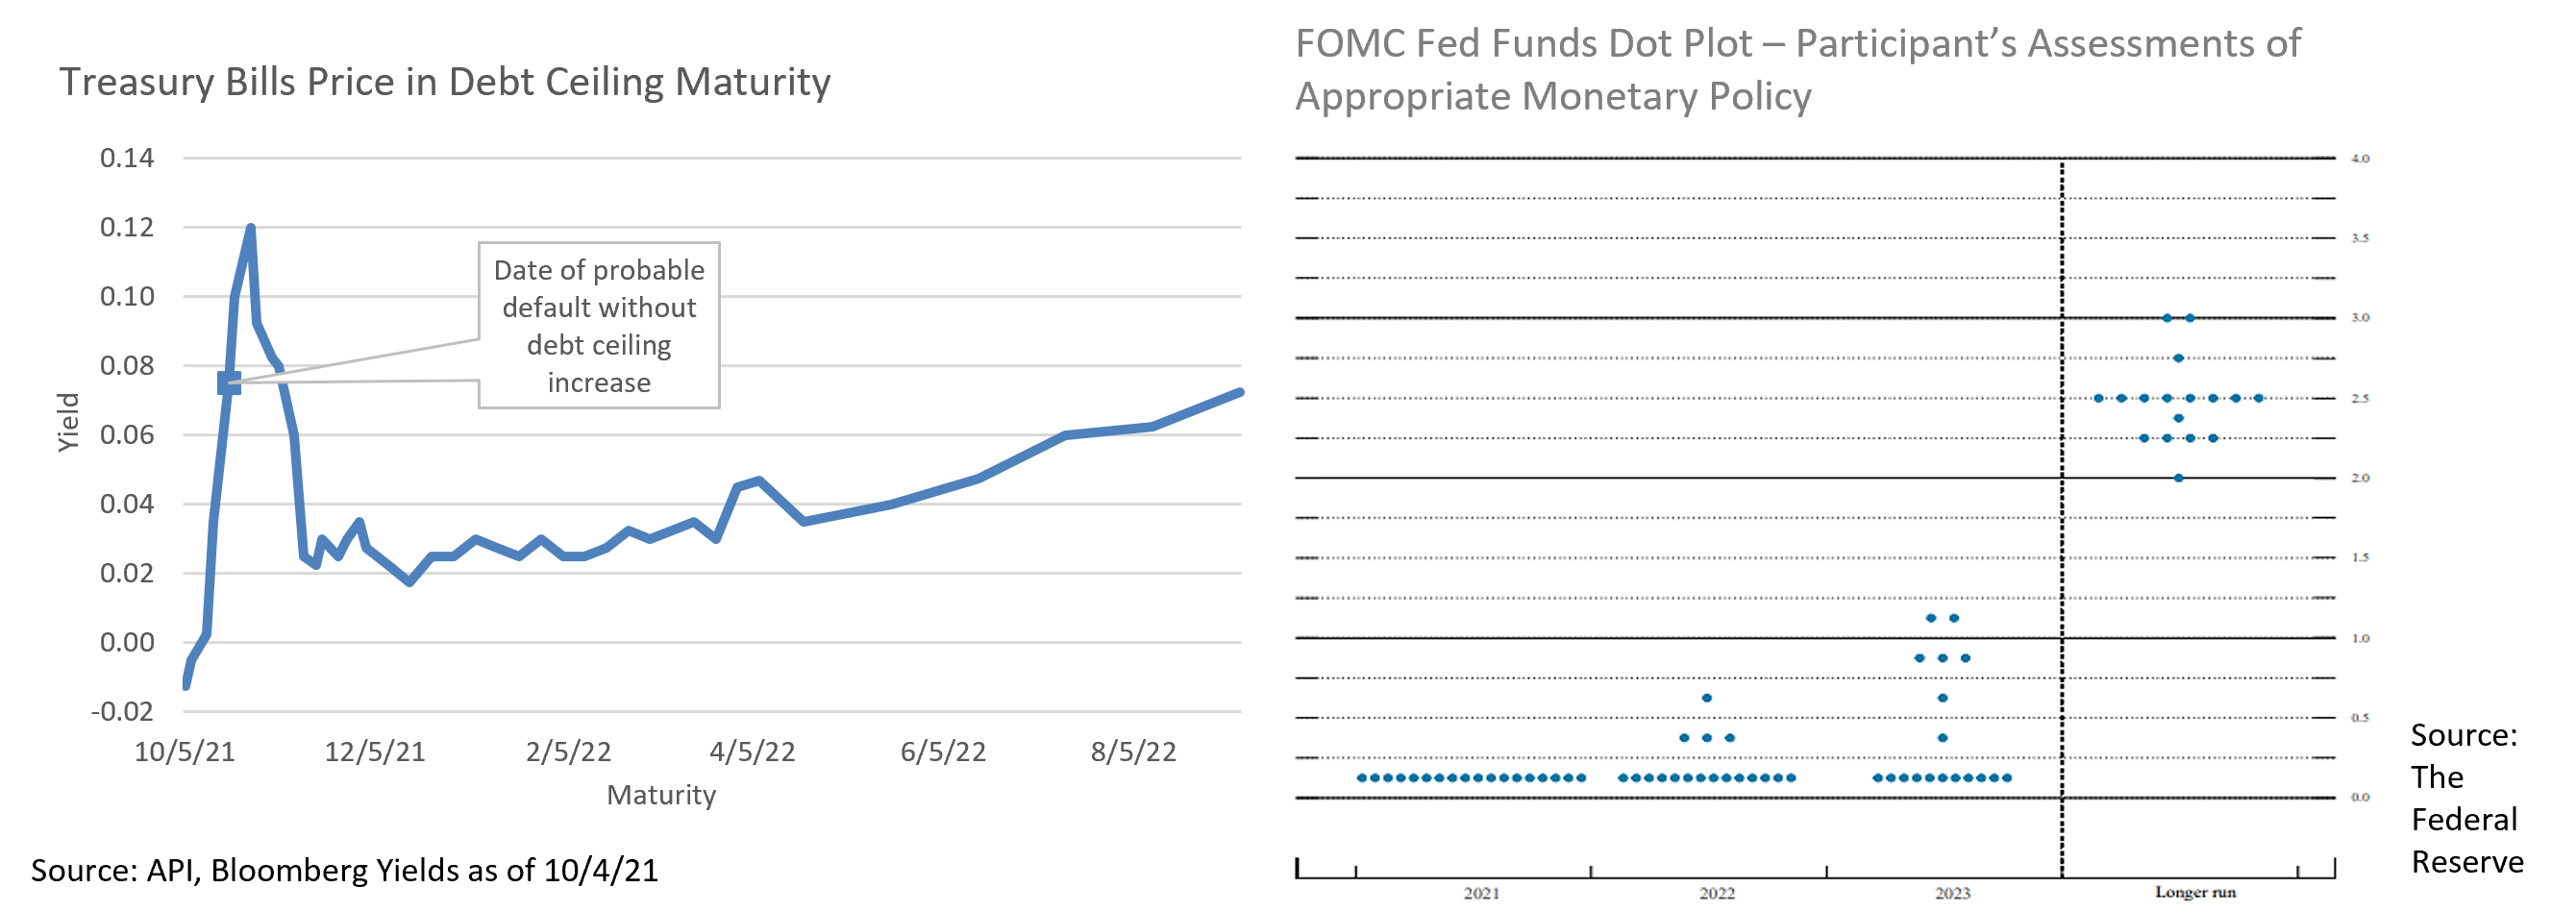
- A potential October surprise was averted in late September when Congress passed a continuing resolution funding the government through December, but legislative hurdles remain on the horizon. Secretary Yellen estimates the debt ceiling will be breeched on 10/18, risking sovereign default in the absence of Congressional action. Republicans have thus far blocked Democratic efforts to raise the limit, expecting them to instead reopen their reconciliation infrastructure bill to add a debt ceiling increase. Short-term yields around the expected drop-dead date have already cheapened relative to maturities before and after, reflecting growing political uncertainty.
- Finding a workable compromise for the reconciliation infrastructure bill has proved quite challenging. Senate moderates have balked at the price tag of the $3.5T “Build Back Better Act” House progressives have tied to the Senate’s bipartisan “hard” infrastructure bill and are pushing for a smaller package. Meanwhile, the progressive caucus is refusing to support the bipartisan bill unless the Senate passes their own bill via budgetary reconciliation. With Democrats holding extremely narrow margins in Congress, the fate of both bills and their impact on the markets is highly uncertain.
- Debate over whether the Fed was right to expect “transient” inflation in 2021 is becoming less relevant, as it was predicated on a reopening economy with COVID behind us. Instead, Delta continues to depress demand at home and supply abroad. US retail sales did surprise in September, but with evidence of a “substitution” effect with consumers foregoing services for goods. Similar patterns were also evident in a CPI miss that saw reopening-sensitive sectors such as transportation and hotel accommodations account for much of the shortfall. While PPI ex-food, energy, and trade, a popular “core” purchasing manager inflation metric, rose by the least amount since November, the headline number still exceeded expectations and survey respondents reported continued supply chain pressures. Purchasing managers indicated they expect to pass on costs, so there is a good chance PPI will flow into lingering consumer inflation as COVID continues to disrupt the global economy.
- Labor supply is confounding markets as well. While the ISM Manufacturing report employment index rose modestly from 49.0 to 50.2, this is barely out of contraction range and companies are still struggling to attract workers. Evidence that enhanced pandemic unemployment benefits were encouraging workers to stay home has weakened. Bloomberg interviews with staffing firms suggest that no rush of new job seekers materialized after these programs ended. At present, there is no consensus on why the workforce is failing to return to pre-pandemic levels, although BLS survey data suggests pandemic related concerns are at least partially to blame.
- September was an interesting month for Fed watchers. First, Chairman Powell emphasized that the Fed is on track to begin tapering, indicating that an announcement could come “as soon as next meeting” on 11/2. Consensus estimates are that tapering will begin in December in the range of $15B a month. Meanwhile, the Fed Funds median dot plot projection has now risen to 1% by the end of 2023 suggesting 2 or 3 hikes by that time. It is important to note though that dispersion is high with no clear consensus – the Fed expects to raise rates by the end of 2023 but lacks agreement on how far.
- A second development may also impact the dot plot; Fed presidents Eric Rosengren (Boston) and Robert Kaplan (Dallas) stepped down at the end of September. Rosengren cited health concerns, although both men had been criticized for aggressive stock trading during the period the Fed was preparing its pandemic fiscal support. Both were staunch hawks, and Rosengren was due to take a voting seat on the FOMC in 2022, so their departures could potentially lower the dot plot median and may produce a more dovish FOMC.


Equity News and Notes
A Look at the Markets
- Last month we cautioned that September has been the worst month for stocks over the past two decades and this year stayed true to form. The S&P 500 fell -4.6% which snapped a 7-month winning streak and marked the worst month since the start of the pandemic. Still, the S&P was able to eke out its sixth straight quarterly gain, finishing Q3 at +0.6%, bringing YTD total return to +15.9%.
- September’s volatility comes amid a host of uncertainties: the looming Fed taper, supply chain concerns, a slowing rate of economic growth, potential for Q3 corporate earnings disappointments, and a slowdown in China. The “wall of worry” has since grown taller as familiar political brinksmanship in Washington has investors on edge. We doubt Congress goes down the same road as 2011 when the S&P downgraded US debt and expect the debt ceiling to be addressed in the coming weeks. The size and scope of the infrastructure and social safety net spending packages are in flux though, and investors are likely to greet uncertainty with more risk-off sentiment. If the ultimate size of Biden’s $3.5 trillion “social infrastructure” economic plan comes down (projections now center around a figure closer to $2 trillion), a bullish outcome could be less significant tax increases.
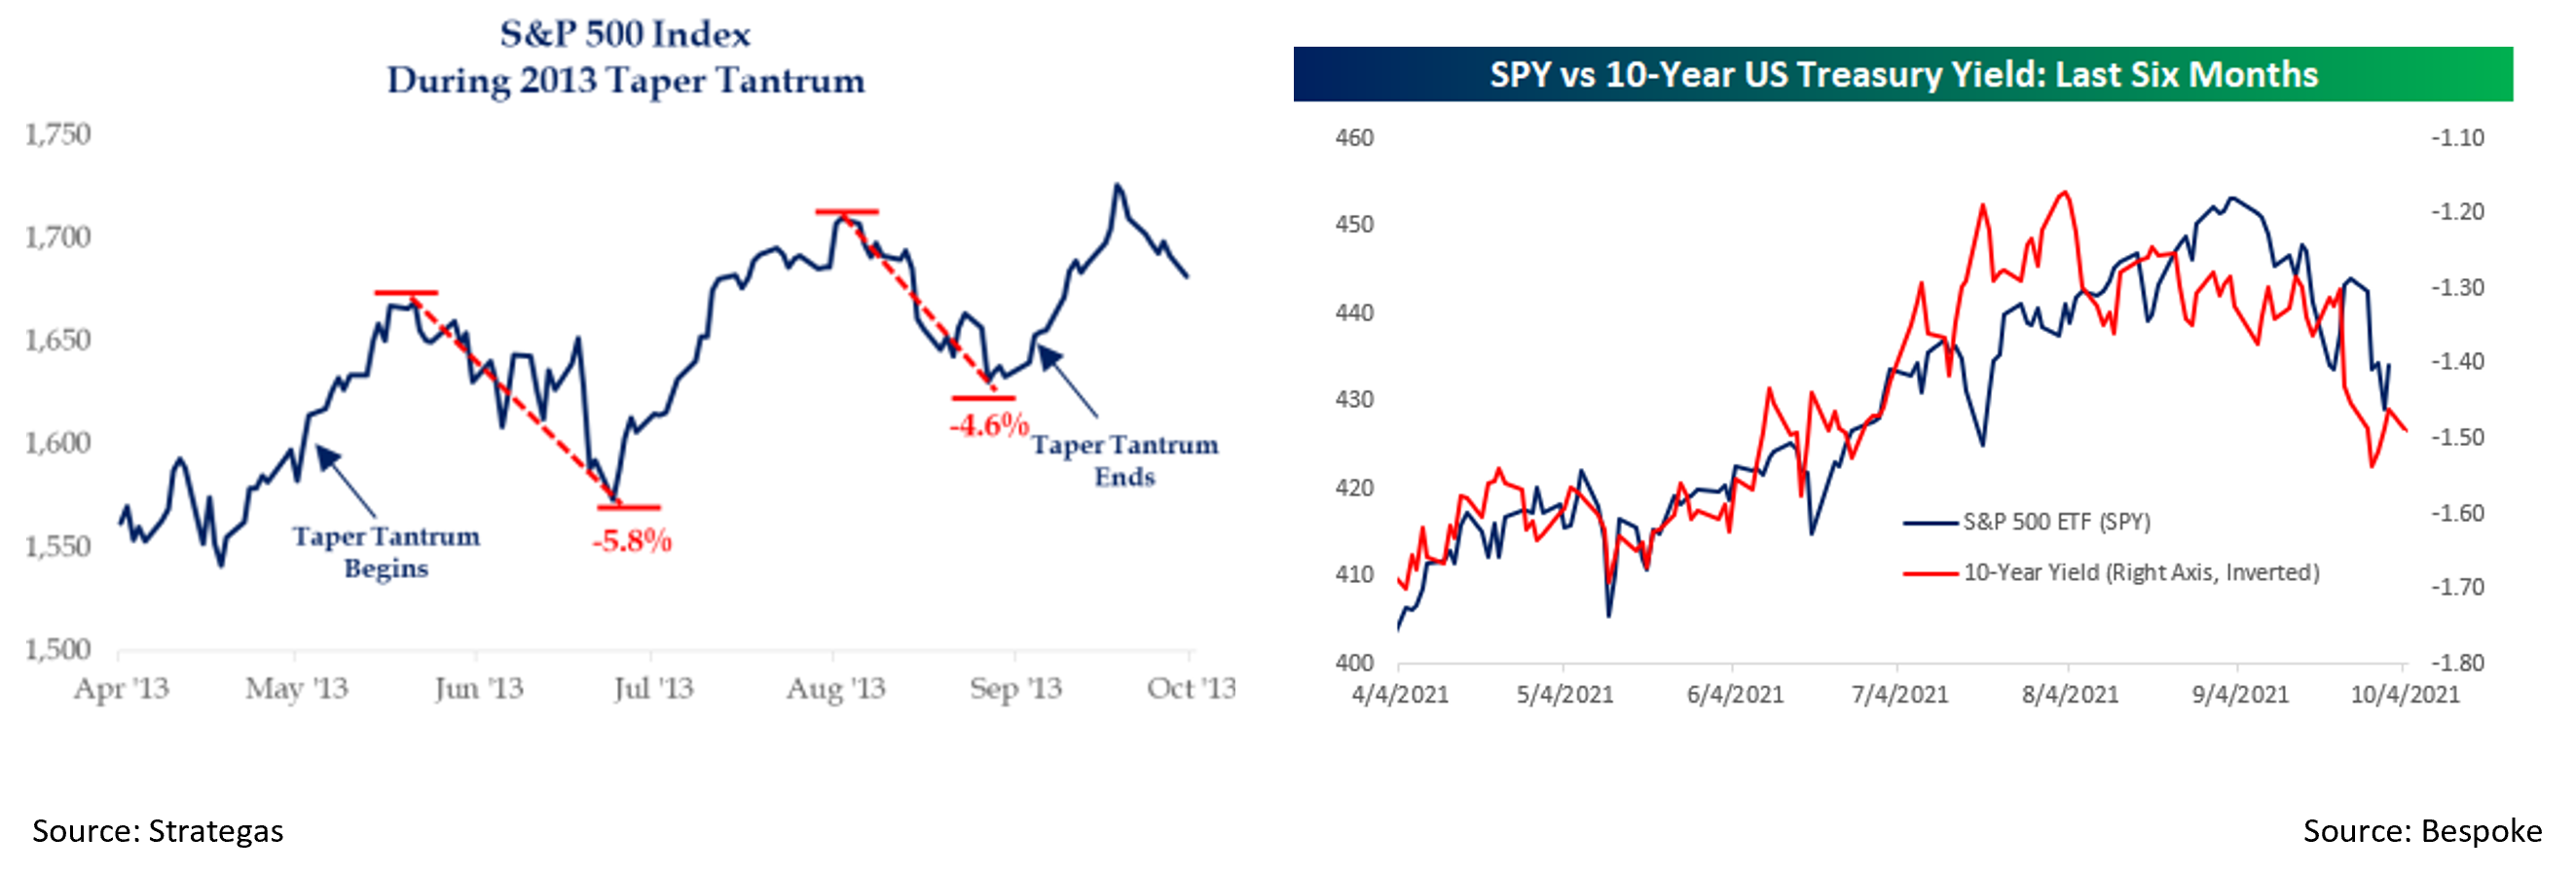
- At their latest meeting Chairman Powell indicated that it might be appropriate for the Fed to begin reducing the size of their monthly asset purchases. Starting in November, the purchases are likely to be reduced by $15 billion per month over the subsequent 8 months with the Fed buying program ending in June 2022. While we would agree that tapering is hawkish relative to interest rates, it has been widely telegraphed and doesn’t indicate that the Fed will be raising rates anytime soon. Given the fear of a monetary policy error, it is helpful to look at how the stock market reacted in 2013 to the last major tapering. The path for equities was ultimately higher, but not without volatility, as investors grappled with taper consequences and what it signaled relative to interest rate liftoff.
- Although rates moved higher following the most recent Fed meeting, it is worth noting that the 10Yr UST yield bottomed in early August at ~1.15%. The subsequent move higher did not impact the stock market much, but investors have recently taken note with the 10Yr closing Q3 at ~1.50%. The latest moves in equities, both in aggregate and at the sector/style level, feel very similar to the February/March period earlier this year. The 10Yr moved from 0.90% to start the year and peaked at 1.75% on March 31. During that time, we noted how cyclical sectors like Energy and Financials outperformed while growth sectors such as Technology and Communications Services underperformed. This had an impact on broader averages as the Dow and small caps outperformed the S&P 500 and Nasdaq. Value has gotten a relative lift versus growth from a style perspective led by a rotation into Financials and Energy. We expect this rotation to proceed until interest rates settle and continue to favor a barbell approach with some cyclical exposure to balance against the growth sectors.
- The S&P 500 closed the quarter 5.1% off its September 2nd all-time high, the first time it’s been more than 5% below a high since October of 2021. We have often said that although drawdowns and corrections are normal and healthy, investors rarely feel that way as they are occurring. Suffice it to say, we concur wholeheartedly with the market adage, “Drawdowns are a feature, not a bug, of the market.”

From the Trading Desk
Municipal Markets
- The municipal market continues to be supported by robust retail demand. Over the last 72 weeks, 71 have produced net mutual fund inflows, the sum of which exceeds $150 billion. This sustained demand has been coupled with modest issuance, most recently evidenced by a 33% reduction in new supply in September versus the same month of 2020. Although YTD issuance is just 2.4% lower than the same period of 2020, buyers are still facing a tight market characterized by somewhat limited primary and secondary market bond availability.
- Taxable municipal supply remains a factor in restraining the overall tax-exempt supply picture. Over the course of 2021, taxable issuance has accounted for about 24% of total new supply, down somewhat from an elevated 30% in 2020. While the percentage is slightly lower this year than last, it remains high by historical standards and has effectively reduced the buying universe for tax-exempt debt.
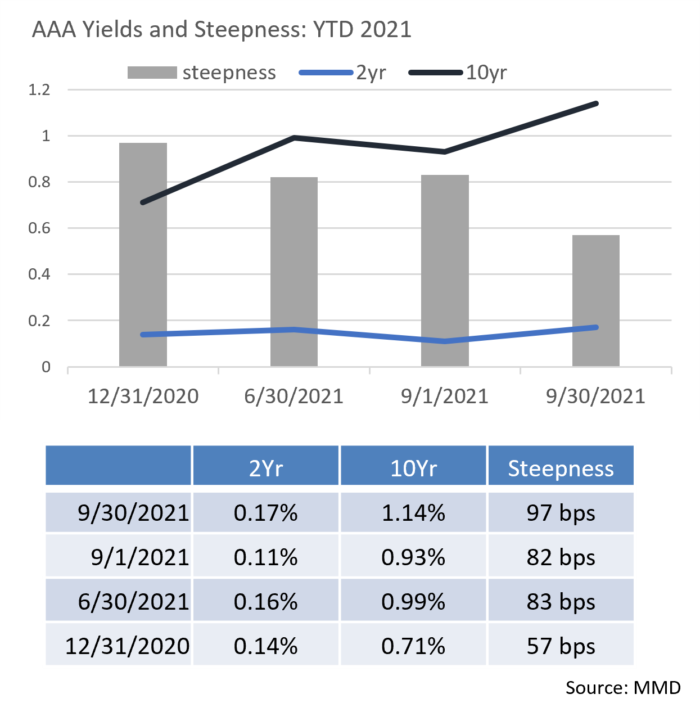
- The yield curve, taking cues from taxables, rose over the month giving traders an opportunity to take advantage of slightly higher rates. The 10Yr AAA municipal yield rose to 1.14% at the end of the month, up from 0.93% at the start. The 2 to 10-year municipal curve also steepened to 97bps from 82bps, which makes extending from shorter bonds into the 10-year range more attractive.

Corporate Bond Markets
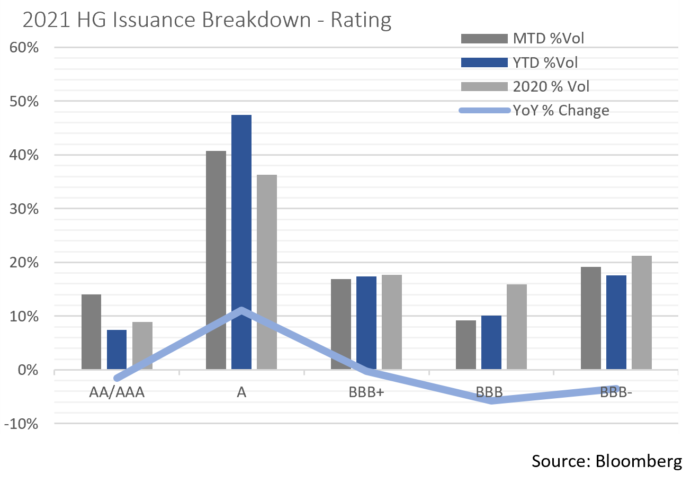
- The pace of 2021 Investment Grade issuance has been slightly heavier than the historical average as borrowers have moved to capitalize on a favorable environment. The $158.19 billion of new Investment Grade debt issued in September brings the YTD total to $1,121.49 billion. That is roughly on pace with the record $1,542 billion set in 2020 and is already 21% ahead of 2019 ($923.6 billion). BBB-rated names represented roughly 45% of last month’s new deals, while higher rated names rounded out the balance. The increase in higher rated bonds coming to market is noticeable as the Finance and Technology sectors have actively returned to the debt markets for refinancing purposes. Barring unforeseen rate shifts or changes in risk appetite, we expect issuance to moderate over the balance of 2021, a development that would be positive for spreads.
- Relative stability of macro factors, favorable market technicals, and strong credit fundamentals continue to create a strong foundation for IG credit. After hitting a YTD low of 80 OAS on the Bloomberg Barclays US Corporate Index in June, spreads have traded in a very tight band and nearly breached that low on 9/27 with an 82 OAS close. In our view, the factors most likely to put pressure on spreads lie in the potential for debt ceiling disruption and/or sustained inflation. These, more so than a reduction in Fed asset purchasing, are what concerns us as we enter Q4. Nonetheless, we still expect a continuation of credit spread resiliency through the remainder of the year.
- The Federal Reserve’s slight tone shift in this past month’s FOMC meeting drove UST yields higher, producing intermediate curve steepening. Spreads between the 2Yr and 10Yr hit 120 bps, as compared to a 10Yr to 30Yr differential of only 56 bps, just 5 bps off the year’s low. Most of the Fed rate response occurred in the intermediate portion of the curve with 5, 7, and 10Yr maturities higher by 19 to 21 bps. The 10Yr UST closed Q3 at 1.49% and the long bond was higher by 13 bps at 2.05%. While we remain cautious about duration, the intermediate part of the curve is providing opportunities to add incremental yield.

Financial Planning Perspectives
Educational Savings: Don’t Forget About 529 Plans
 With school starting up just last month, the time seems right to focus on the benefits of investing in 529 College Savings Plans. Paying for college is anything but easy, and for many it may seem insurmountable, yet efficient funding strategies can go a long way in scaling the educational savings mountain.
529 Savings Plan Benefits
All states offer their own 529 plan sponsored by a financial institution. For example, Massachusetts’ 529 plan is administered by Fidelity Investments. There is a common misconception that one must utilize 529 plan savings to meet expenses at a school within their home state, or in the state where their student ultimately matriculates. That is not the case.
Although 529 contributions are not deductible at the federal level, some states offer a tax deduction when their residents contribute to their state’s plan. If so, they are generally capped and may include in-state enrollment requirements. We recommend checking your state’s deductibility rules to determine their 529 tax policies. It is also worth considering additional criteria such as investment options, investment costs, and plan fees before selecting a 529 savings plan.
Contributions are made with after-tax dollars. As account balances grow over time, they do so tax-deferred, thereby allowing your savings to compound at a greater rate than if taxes were due on income and capital gains.
Perhaps the most well-known benefit of 529 plans lies in the ability of investors to withdraw principal and earnings on a tax-free basis provided they are applied to qualified educational expenses. It won’t come as a surprise that expenses such as college tuition, room and board, books and other instructional materials are considered qualified educational expenses. Other eligible expenses include:

- Lab fees, supplies and other elements associated with college curriculums
- Tuition for private K-12 education up to a $10K/year limitation
- Graduate school expenses
- Student loan payments up to a $10K lifetime limit
Funding Strategy Considerations:
Contributions are generally limited to $15K per year per beneficiary, per gift giver. In other words, a married couple may contribute $30K/year for an individual child. If that $15K number looks familiar, it’s because it is consistent with the IRS allowable annual gift exclusion amount and is expected to increase with that cap over time.
Gifts may also be “bundled,” a stipulation that allows a donor funding a 529 plan to contribute up to 5 years’ worth of gifts ($75K) at one time for each beneficiary. For example, a $75K deposit into a 529 plan in December 2021 would cover gifts for calendar years 2021 – 2025. Once the calendar turns to Jan 1, 2026, the donor would be eligible to make additional educational savings gifts for that beneficiary.
The beneficiary (student) listed on a 529 account may also be changed once per calendar year. This creates valuable flexibility as it allows unused funds of one student to be transferred to another child, or a niece, nephew, or other family member.
Education is often considered a gift passed down from generation to generation. Funding it can certainly be challenging, yet 529 educational savings plans can make the process less burdensome. Let us help you get started.
For questions concerning our financial planning or wealth management services, please contact
Jim O’Neil, Managing Director, 617-338-0700 x775, [email protected]


