Insights and Observations
Economic, Public Policy, and Fed Developments
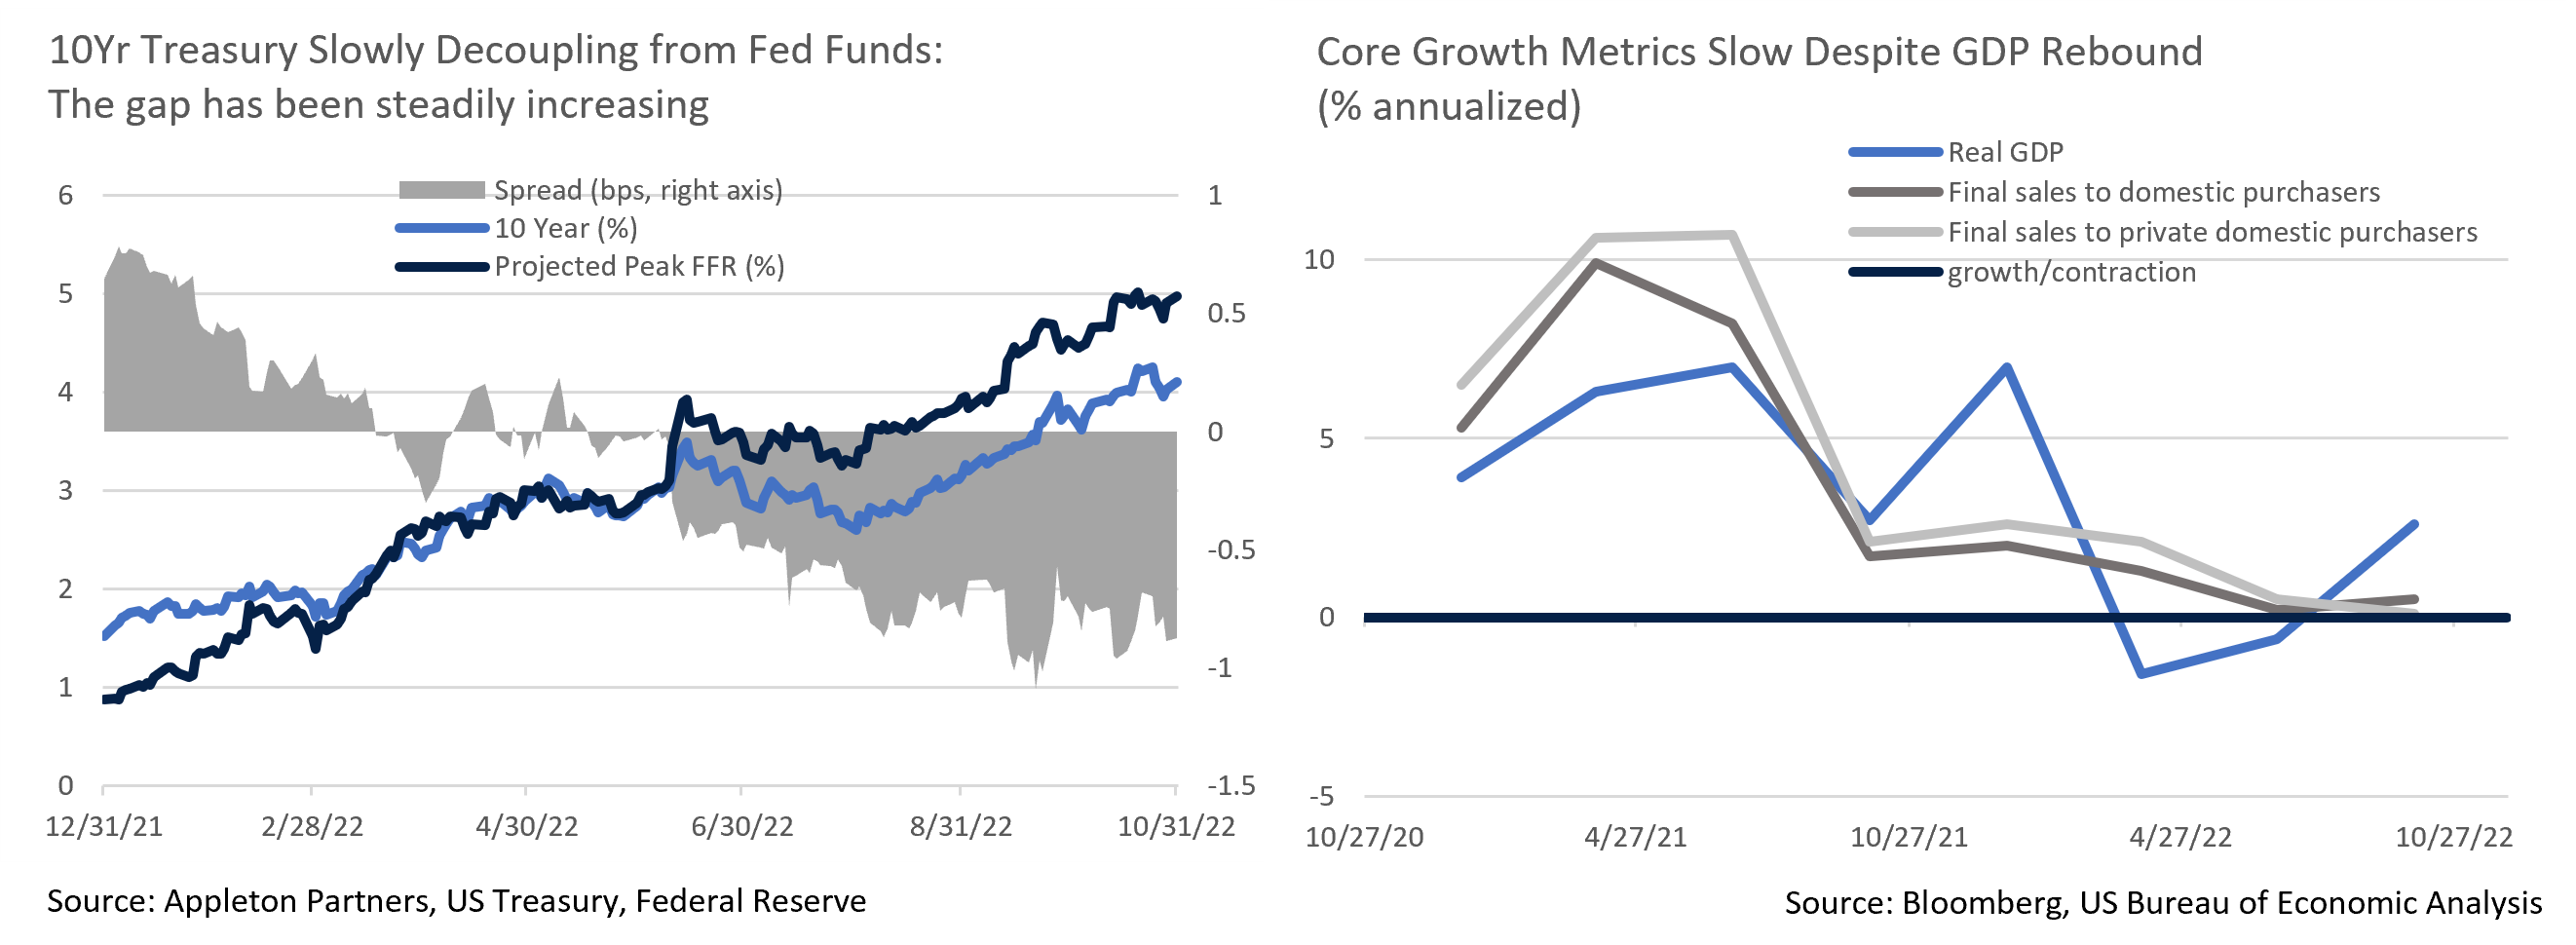
- On the surface, the Q3 GDP report was strong with growth two tenths above expectations at +2.6%. Details, however, were far less positive. Growth was boosted by a +2.8% contribution from highly volatile net exports. Final sales to domestic purchasers and final sales to private domestic purchasers, better indicators of the economy’s sustainable growth rate, both slowed and are now barely above contraction. These measures suggest stagnating economic activity.
- Consumer activity is sending conflicting messages despite weak personal consumption, which a Federal Reserve focused on lowering demand to align with supply constraints should welcome, although it strengthened to the highest levels since Fall 2021 later in the quarter. This is a poor omen for the Fed’s fight to right-size consumer demand to match supply. It is possible the August and September increases were temporary and driven by falling gas prices, but for now it appears the Fed has more work to do.
- Inflation failed to cool in September, with both Producer and Consumer core inflation surprising to the upside. PPI now shows an accelerating trend in the final demand services component, which rose 0.2% in July, 0.3% in August, and 0.4% in September. Core CPI’s +0.6% shows essentially no weakening since the start of the hiking cycle. Flat CPI core goods inflation and solid improvement in supply chain related ISM components imply we may have already seen most of the benefit from easing supply chains, and in turn a more aggressive Fed response will be needed.
- Wage growth decelerated in September, from +1.4% to +1.3% for all civilians, and +1.6% to +1.2% for private sector workers. This is welcome, though labor demand still appears hot. With core PPI inflation running at +8.4%, labor remains cheap on a relative basis compared to other production inputs. Indeed, the JOLTS survey surprised by increasing to 10.7M job openings, rather than falling to 9.8M as expected. If the Fed is looking for the unemployment rate to rise to 3.8% by year-end and 4.4% by 2023, they will likely first have to see a meaningful fall in inflation.
- More encouraging was the decline in rents, which are now following home prices downwards. While still up 7.5% YoY, this is down from 18% at the start of the year. This comes as the yearly change in the Case-Shiller Index posted the single biggest one-month deceleration in history, from +15.6% to +13%, in August. It will take some time before these changes flow through into inflation indices, but it is a welcome sign.
- As widely expected, the Federal Reserve raised short term rates 75bps in its meeting on 11/2. Markets initially took language in the press release that the Fed would take the “cumulative tightening of monetary policy” into account when evaluating future increases as a dovish pivot. Powell quickly clamped down on this in his press conference, indicating it was “very premature to think about pausing,” and that when hikes slow is “a much less important question” than how high they hike. We expect the pace of future hikes to slow, possibly as early as December, but anticipate Fed projections to show a higher terminal rate than the 5% the market is now pricing. The 10Yr UST has been slowly decoupling from Fed Funds as the year has gone on, so this should lead to further curve inversion.
- On a lighter note, British PM Liz Truss failed to outlast a head of lettuce in the Daily Star’s mock horserace, becoming the shortest-lived Prime Minister in British history after her government imploded in the fallout of a disastrous budget proposal. New Prime Minister Rishi Sunak vowed a return to financial stability, to favorable market response.

Equity News and Notes
A Look at the Markets
- Stocks rebounded in October following the worst month since the pandemic began as the S&P rose 8.0% to pare the YTD decline to -18.7%. The Dow produced a notably larger gain (+13.9%), posting its best month since 1976 and the strongest October in 100 years. The Nasdaq lagged (+3.9%) given greater exposure to the Communication Services and Consumer Discretionary sectors. Cyclicals led the way higher amongst S&P 500 sectors with Energy (+24.8%), Industrials (+13.9%), and Financials (+11.8%) all easily outperforming. Given such sector level dispersion, Large Value beat Large Growth by 4.3%.
- October’s gains came despite sustained volatility, with the S&P closing at least +/- 1% an unusually high 12 of the month’s 21 trading days. A wild month was best illustrated by the S&P 500 hitting a YTD intraday low of 3,491 on 10/13 following a hot CPI print and then dramatically reversing to close the same trading day up 5.1%, a stunning reversal.
- During times of turbulence and when fundamentals are murky, traders often look to technical factors. The 200-week moving average has once again been offering support as traders scramble to cover widespread short positioning, itself an indicator of downtrodden sentiment. We expect further volatility and for technicals to play an outsized factor until such time as greater clarity on the economy, corporate earnings, and most importantly, the Fed’s monetary policy path is clarified.
- The market remains Fed centric as the central bank attempts to cool inflation without significantly damaging the economy. A nearly 11% rally off mid-October lows gained steam late in the month following a WSJ article suggesting the Fed would entertain slowing the pace of rate increases at the December meeting. Central banks in Canada, Australia, and the EU have already had similar discussions, fueling the Fed-pivot narrative. Signs of potentially easing inflation are evident, including a downtick in commodities, rents, and car prices, a housing slowdown, and supply chain improvement. However, the Fed is likely to focus on the jobs market which remains tight. The Fed remains data dependent and several more raises are likely after December, albeit of smaller increments. The “good news is bad” mantra should continue until economic conditions allow the Fed to assertively demonstrate that they are closing in on the end of this tightening cycle.
- Q3 earnings are in full swing with just over half of the S&P 500 having reported. Results have been mixed with 71% of companies beating earnings estimates and 68% beating revenue estimates. Blended earnings growth is currently +2.2%, a growth rate that would be the lowest since Q3 of 2020 if it stands. The market has been able to rally on reduced expectations despite notable misses from a handful of mega-cap tech companies. We are tracking reductions in 2023 aggregate earnings estimates as companies warn of economic, geopolitical, and policy uncertainties. That said, valuations have also come down meaningfully (the S&P 500 now carries a 16.3x forward P/E). Should the Fed show any hint of a dovish pivot, we could see multiples expand and lift the market despite slowing earnings growth.
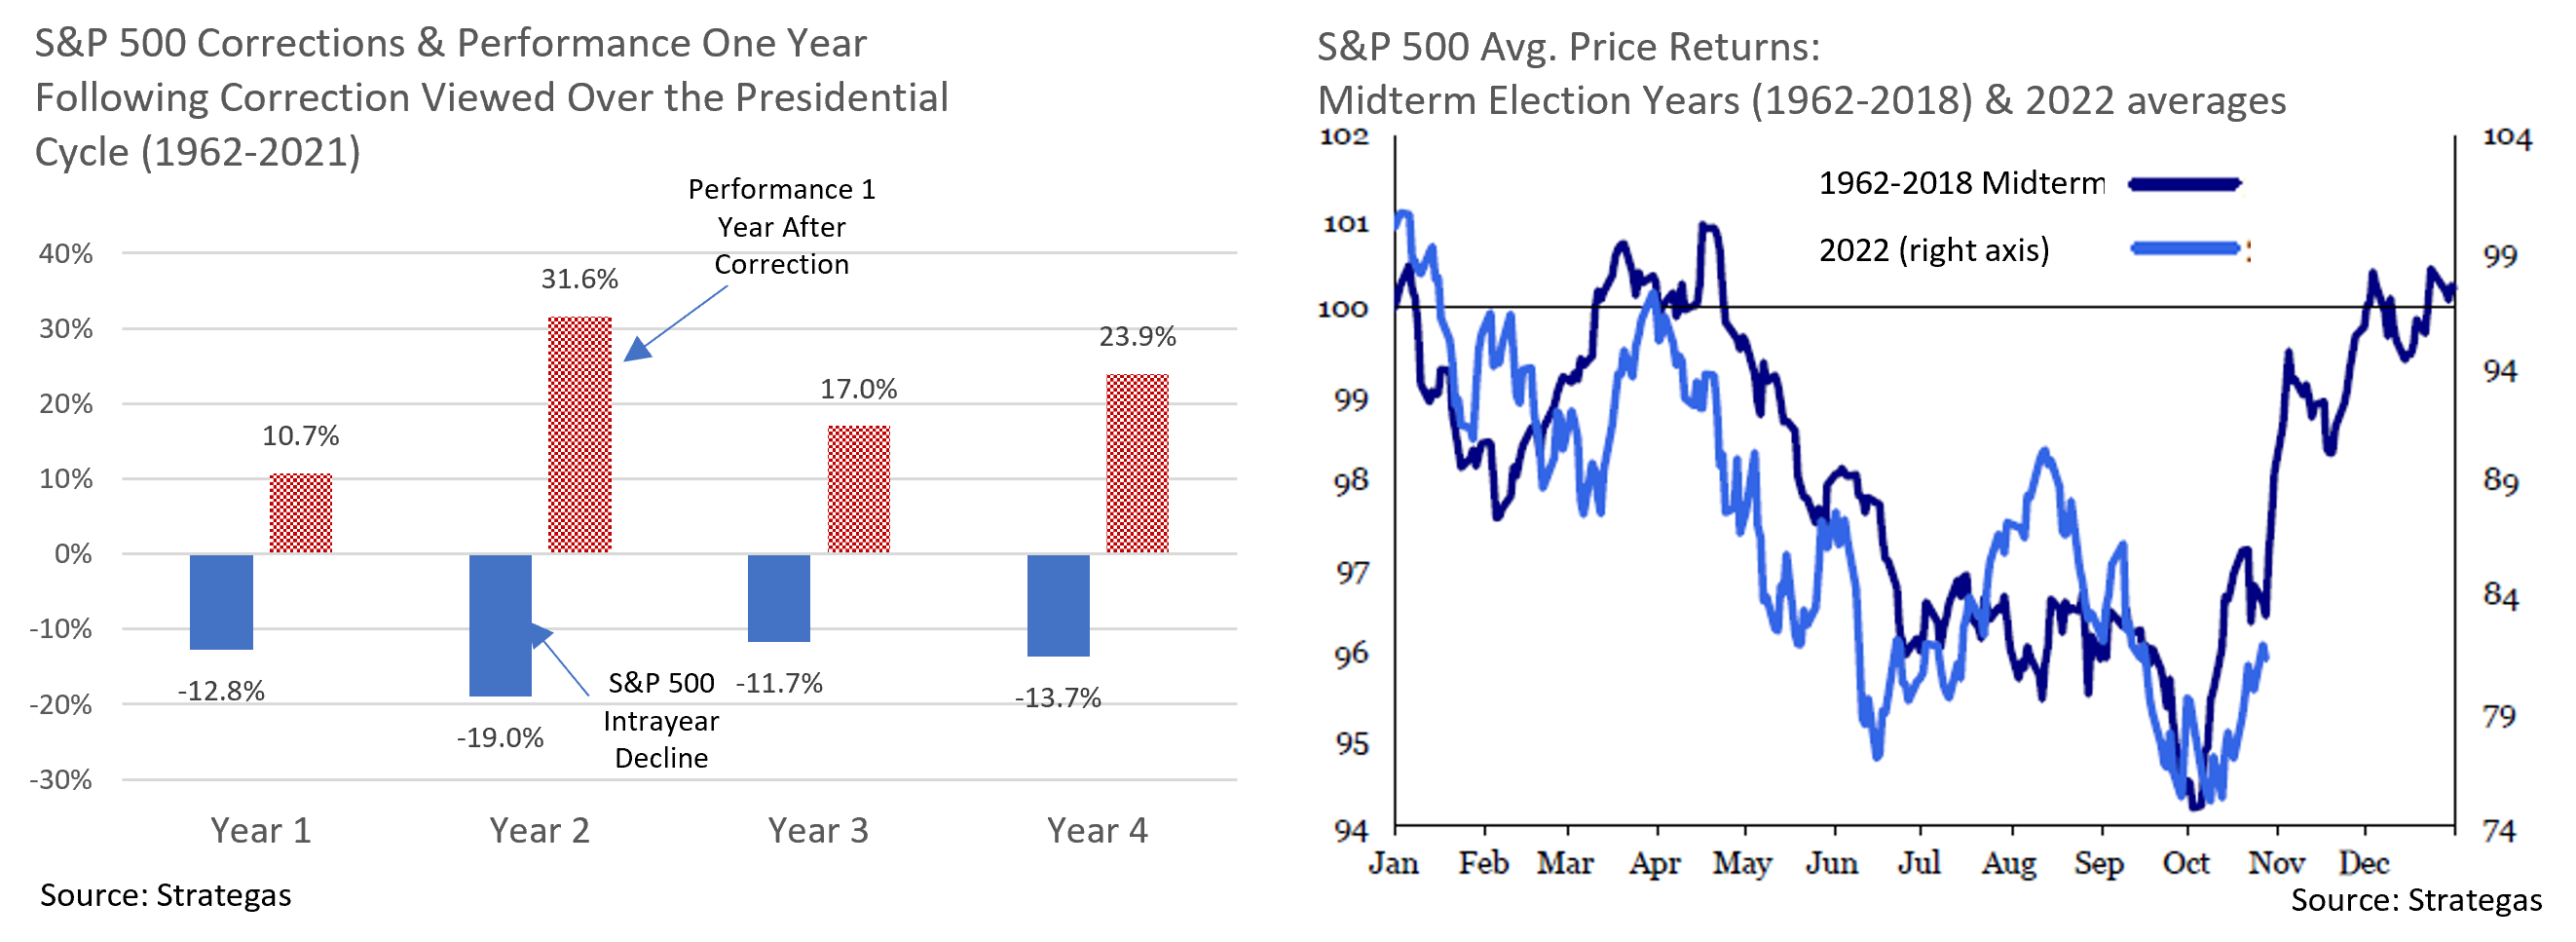
- November brings midterm elections, years that tend to be volatile with deeper than average drawdowns. While Senate control appears to be a toss-up, the GOP is likely to take the House, producing a degree of political gridlock with a Democrat in the Oval Office. Markets tend to prefer gridlock as it favors the status quo and minimizes the risk of unwelcome policy developments. Regardless of the outcome, simply putting the midterms behind us could prove to be a catalyst for stocks as has historically often been the case. The S&P 500 has not declined in the 12 months following a mid-term election since 1942. However, a word of caution; the economy has never been in a recession in any of those post-mid-term periods.

From the Trading Desk
Municipal Markets
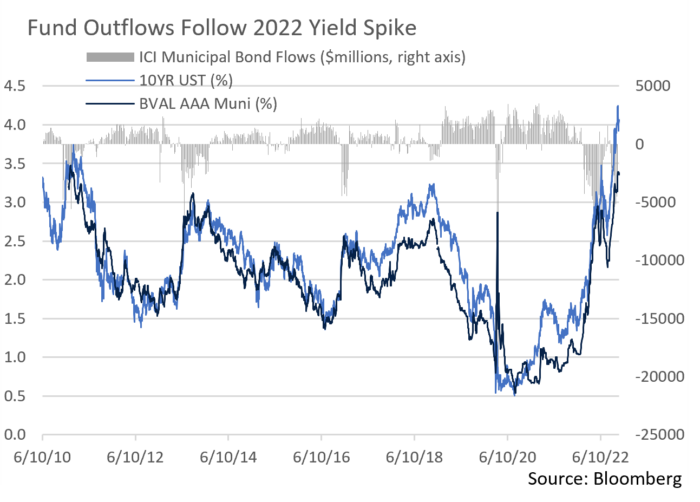
- 2022 has so far reversed previously prevailing municipal investor sentiment. October ended with the 12th consecutive week of net fund outflows and the negative aggregate YTD figure now exceeds $100 billion. Not surprisingly given this year’s volatile environment, long-term funds have incurred the highest net redemptions. Although fund flows are hardly the only technical barometer, retail sentiment has clearly receded, reducing support for the tax-exempt market. But with taxable-equivalent yields on high quality intermediate maturity issues in high tax states exceeding 6%, we anticipate a return to positive fund flows in the months ahead.
- October ended on a bear steepening trend as 30-year AAA yields rose to 4.14%. The front end of the curve remains quite flat though, with 2 to 5-year and 2 to 10-year spreads of only 6 bps and 23 bps, respectively. Relative steepness remains more attractive among 9 to 12-year maturities, an area of the curve we are targeting in many client portfolios.
- Lagging supply continues to characterize the municipal market, contributing to challenging conditions in which to transact. October issuance declined 49% vs. 2021 as rate volatility and Fed policy uncertainty weighed on issuers. Total issuance is off 17% YTD and Merrill Lynch now expects negative net issuance to exceed $60 billion in 2022.
- As next week’s midterm elections approach, California and Massachusetts are getting attention due to ballot measures that propose raising taxes on their wealthiest residents.
- Massachusetts has a 5% flat income tax, and the ballot measure would add a 4% tax surcharge on adjusted gross income above $1 million. California already has the nation’s highest marginal income tax rate, and the ballot measure would levy an additional 1.75% tax on adjusted gross incomes above $2 million. If approved, these measures would further enhance the attractiveness of tax-exempt bonds. Colorado voters will also be asked to decide whether to cut the state income tax rate from 4.55% to 4.40% while limiting standard and itemized deductions for filers earning at least $300k.
Corporate Bond Markets
- A highly atypical year in the bond market now has investors acutely focused on UST liquidity and looking to the Treasury Department for insight. In its quarterly survey of primary dealers, the Treasury asked for opinions on its debt buyback program. This signaled that the Treasury Advisory Committee may recommend taking steps to support liquidity if they are deemed necessary. Concern has been focused on waning liquidity among off-the-run bonds in the secondary market, and a potential mitigating step might involve the Treasury buying as well as increasing their purchases of TIPS. A refunding announcement on 11/2 may offer color on a potential Treasury buyback program even if immediate action is not forthcoming. Nonetheless, the groundwork for a more formalized program could well come in the January announcement.
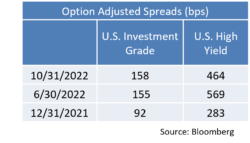
- The option adjusted spread on the Bloomberg US Corporate Bond Index ended October at 158bps, 7bps off a 10/12 YTD high of 165bps. Excess return on corporates relative to USTs was essentially flat to slightly higher as we began the month at 159bps. Over the last three months credit spreads have fluctuated within a 30bps range, narrowing slightly from larger ranges earlier in the year. In our view, spread volatility will remain evident but stay contained close to the current range.
- After a less than stellar month of issuance in September, the Investment Grade primary market came back to life in October with $83.2 billion coming to market. The metrics (concessions, interest, and performance) that we typically look at on new deals all improved as strong demand materialized. New issue concessions were down to 12.3bps from a YTD average of 13bps and deals were nearly 4 times oversubscribed. An uptick in issuance and the solid performance of the deals that came last month helped to keep credit spreads in a relatively tight range. While YTD issuance still trails 2021 by ~15%, we expect more issuers to be willing to meet investor demand over the next couple of months and would view this as a positive influence on spreads.

Financial Planning Perspectives
Tax-Loss Harvesting Can Deliver Savings at Filing Time
 For many investors, there may be a silver lining to a stock holding that has declined in value: tax-loss harvesting, a strategy designed to generate net tax savings by selling investments at a loss. Those losses can often be used to offset some, or possibly all, of the capital gains produced by other investments. To the right we look at a simple example.
Assuming both stocks were held for less than a year (short-term) or more than a year (long-term), the loss from the sale of Stock B would typically be able to offset the realized gain from the sale of Stock A. As a result, selling Stock B allows the investor to save $100 times the prevailing capital gains tax rate on the sale of Stock A.1
Using Volatility to Your Advantage
Tax-loss harvesting allows investors to benefit from turbulent markets and what is typically significant dispersion in stock returns. Even in years when the performance of the broad markets is positive, individual stocks may have declined in value, potentially creating tax-loss selling opportunities.
The extent of potential tax savings is influenced by the market environment and the specifics of an investor’s holdings, although low return years will typically generate greater harvesting opportunities than higher performing ones. However, looking for opportunities to harvest losses is recommended in any environment.
Investment Tax Planning Requires a Broad Perspective
Tax-loss harvesting of individual stock holdings can also help reduce capital gains incurred from other elements of a diversified investment portfolio such as appreciated real estate, mutual fund distributions, or private equity or hedge fund distributions. For example, a $2,500 loss on the sale of a stock can offset the same size mutual fund distribution that would otherwise be subject to taxes.
In the absence of capital gains in a given tax year, harvested losses can also be used to offset $3,000 of ordinary income. This includes interest, wages, dividends, and net income from a business. Any excess losses can also be carried forward indefinitely and used to offset capital gains in a future year.
One point of note is that tax-loss harvesting only applies to taxable investments. Retirement accounts such as IRAs and 401(k) accounts are tax-deferred. Therefore, tax loss selling would not be beneficial.
Don’t Get Caught in the Wash
To prevent investors from selling and then very quickly buying back an asset largely for tax purposes, the IRS imposes a wash sale rule. A wash sale occurs when a person sells an investment at a loss and then acquires “substantially identical stock or securities” within 30 days prior to or after the sale. The wash sale rule also applies to any substantially identical stocks or securities purchased by your spouse or company ownership. If a wash sale rule violation occurs, the capital loss is disallowed.
Income Levels Impact Tax Strategy
Lastly, if an investor’s income falls below certain thresholds, it may be a good idea to take profits from assets owned for more than one year, known as long-term capital gains, rather than losses. If you have taxable income under $41,675 for single filers and $83,350 for married couples filing jointly in 2022, long-term capital gains are not taxed (0% rate).
- Capital gains tax rates depend on variables such as the investor’s marginal tax rate, state and local tax rates, and how long a stock was held.
At Appleton, we take great pride in the wealth management and financial planning services provided to our clients. Is there someone you care about who might benefit from working with us, but you’re unsure how to make the introduction? If so, please let us know. We’re happy to help.
Please contact your Portfolio Manager or reach out to:
Jim O’Neil, Managing Director
617-338-0700 x775 | [email protected] | www.www.appletonpartners.com


