Insights and Observations
Economic, Public Policy, and Fed Developments
- Last month we flagged October’s Beige Book as a potential inflection point in economic activity, with the summer’s gangbuster’s growth seemingly slowing to a crawl in late September. Since then, economic data has supported a sudden slowdown.
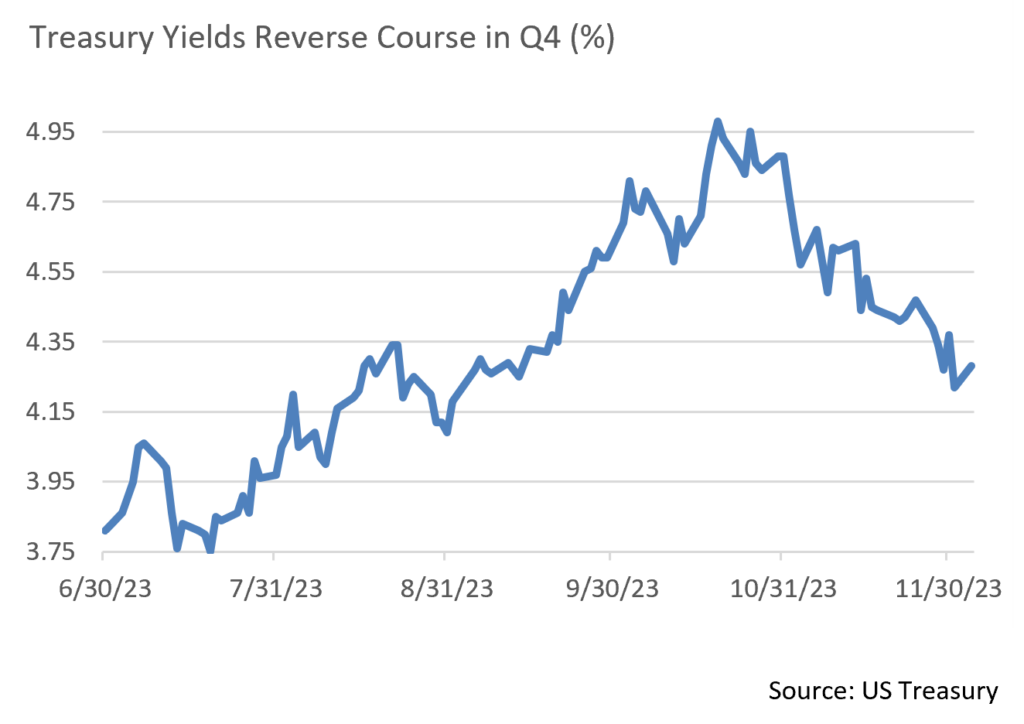
- Weakness was broad-based over the month. A flat CPI print missing expectations of +0.1%, and an outright PPI contraction at -0.5% vs. an expected +0.1% garnered the most attention. However, PCE and personal consumption came in light as well, and while retail sales beat, they merely contracted less than expected. Meanwhile the Fed’s preferred “supercore” inflation measure unexpectedly dropped to +0.15%, suggesting service price pressures are easing too. The result was a broad market rally; Treasuries fell more than 70bps, closing at 4.22% on 12/1, while equities hit new YTD highs.
- A lot will depend on how services hold up relative to goods from here, but the smaller goods portion of the economy is already in recession. ISM Manufacturing has been in contraction for 13 straight months now and failed to rebound after the end of the UAW strike as many market participants expected. The more forward-looking New Orders sub-index at least rose somewhat but remained firmly in contraction for the 15th straight month. While these are survey measures, factory orders data released on 12/4 also showed softness, contracting more than expected on the back of a downwards prior revision. As this was an October period release (vs. November ISM data), it is possible the release may have been influenced by the UAW strike, but even ex-transportation, the report was weak.
- Meanwhile, November’s Beige Book release provides further cause for concern. Participants attributed October’s weakness to strikes (an explanation we reject) and were looking for a November bounce back. This failed to materialize, with two thirds of the districts reporting either flat growth or contraction. While Q3’s GDP growth rate was revised up to +5.2%, the Atlanta’s Q4 GDPNowcast continues to fall, and had dropped from an initial +2.2% to +1.2% at last read. A slower Q4 was almost universally expected after a strong Q3; we believe it may be even weaker than expected.
- Elsewhere, House Speaker Mike Johnson managed to avert a shutdown in mid-November by passing a clean bipartisan continuing resolution funding the government through 1/19 or 2/2 depending on department. It is unclear if he will be able to deliver again, as far right members were vocal about their unhappiness, and the House’s bipartisan expulsion of George Santos lowered the GOP’s majority to three seats.
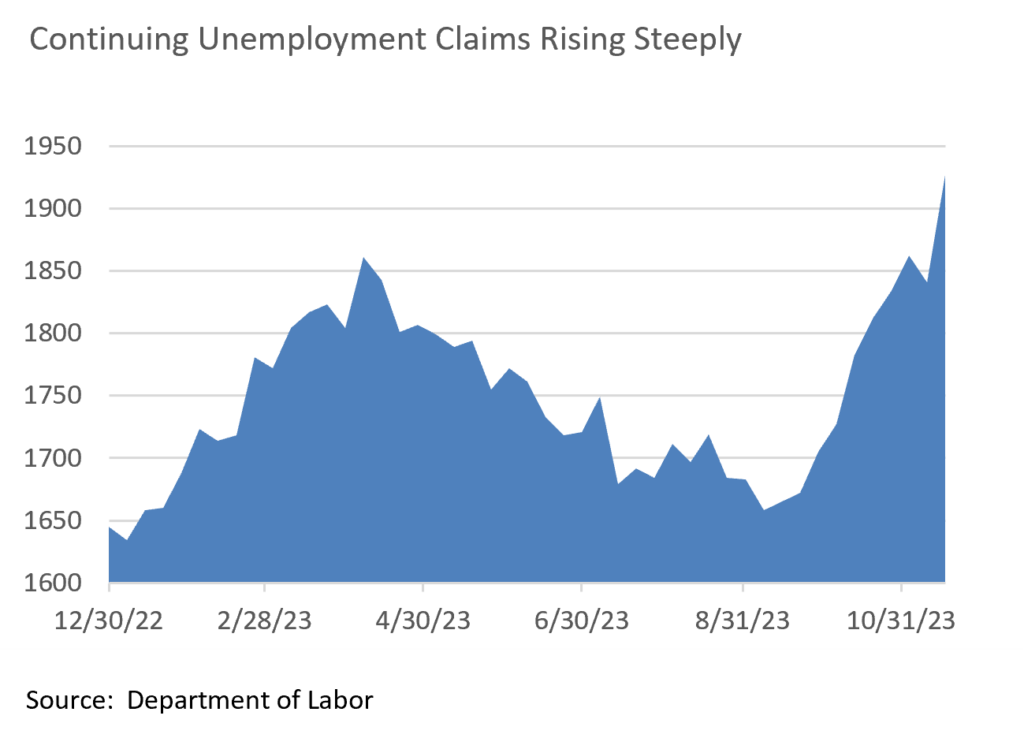
- Friday’s jobs report will also be an important test for the market. The last two Beige Book releases suggest labor slowness but not contraction. Continuing unemployment claims reached 1.93 million in November, however, the highest in two years, and with a large split between the establishment and household surveys in October, risks for November’s report are to the downside.
- The final Federal Reserve meeting of the year on the 13th should pass without incident, with rates almost universally expected to remain unchanged. The Fed has been the dominant economic story for the last two years, but as inflation fades the Central Bank’s influence should recede in importance. We see one last Fed surprise, however; we have been in a “bad news is good news” economy for the last several years, but at some point this will change. We feel a market expecting Powell to continue the “Bernanke put” and cut rates at the first sign of equity market strife is likely to be disappointed so long as inflation is even slightly elevated, and the transition back to bad news being bad news may not be easy.
From the Trading Desk
Municipal Markets
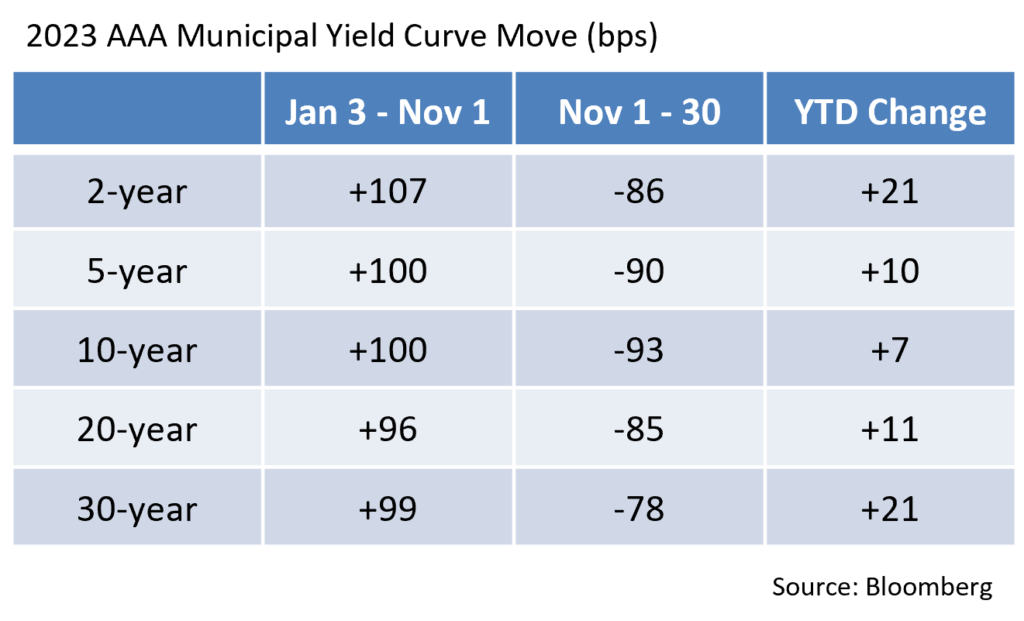
- Municipal bond yields moved sharply downward in November; a reversal driven by what appears to be the end of a six-month uptrend in Treasury yields. A massive rally saw municipal yields drop by 86, 90 and 93bps on the 2, 5 and 10-year points on the AAA curve, respectively. This surge in bond prices produced some of the best returns seen in decades, erasing the losses of the three previous months. On a YTD basis, the Bloomberg Managed Money Short/Intermediate Index now posts a +2.51% return heading into the final month of 2023.
- Municipals rallied even more strongly than Treasuries, dropping the 10-year AAA Muni/Treasury ratio from 73% to 62% at month end. Despite relatively rich valuations, we are still finding considerable value in the 8 to 12-year part of the curve and are positioning portfolios to garner additional yield pick-up in the roll to 2024.
- November’s issuance increased considerably as $35 billion came to market, 29% above the same month of last year. The jump in issuance is largely attributed to a nearly 100bps fall in rates, which brought several deals off the sidelines. On a YTD basis, tax-exempt issuance is $306 billion, 3% above 2022 and 2% higher than the 5-year average for the period. With December supply expected to fall short of demand and an estimated $46.8 billion coming back to investors, up from $35 billion in November, we expect technicals to offer performance support. A Fed meeting and holiday shortened weeks will also be factors in keeping municipal issuance down in December.
- This month will be active in the secondary market as managers look to harvest tax loss positions and put cash back to work. Primary market offerings have frequently been oversubscribed, limiting the allocations of new issue bonds. We remain focused on sourcing bonds at attractive relative values in both the primary and secondary market.
Corporate Bond Markets
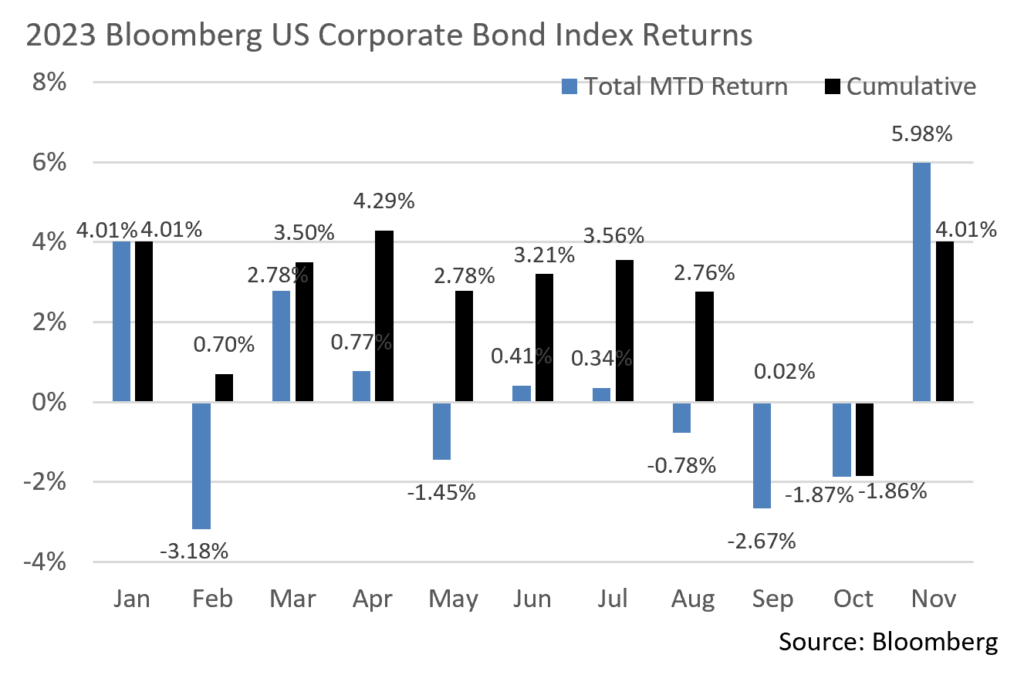
- Risk tone was strong over the course of November and Investment Grade returns were sizable as a result. A significant rally in USTs produced a robust +5.98% monthly return on the Bloomberg Barclays US Corporate Bond Index, raising YTD performance to +4.01%. November’s bond rally represented the best single monthly return since December of 2008. In a “risk-on” environment, longer dated, lower quality bonds performed better than their intermediate, high-quality counterparts. Market momentum going into December remains positive and we do not anticipate surprises from the Fed or in this month’s economic data.
- In combination with a rally in rates, credit spreads narrowed to YTD lows. Spreads on the Bloomberg Barclays US Corporate Bond index touched a low of 104 OAS on 11/30, 11bps below February’s 115 OAS. The strength of Investment Grade credit sentiment is supported by these relatively tight spread levels, the lowest since February of 2022. This credit rally seems to be driven much more by investors taking advantage of elevated yields before they decrease, as opposed to a material reduction in credit risk. While risk remains a factor we carefully assess, credit strength in the higher quality portions of the market is generally improving. Unless there is deterioration in the liquidity environment, we could see modest additional spread compression over the last few weeks of the year.
- The Investment Grade primary market is still strong, although timing is everything and issuers are picking their spots after a lumpy 2023. Expectations for November issuance called for about $100 billion and actual new supply of $98.6 billion closely followed suit. November is generally a strong month as it represents a final push before the holidays and year-end. Deal performance remains solid with new issue concessions hovering around 8bps and order books over 3 times covered. Spread compression in the days following new deals has often been significant as some participants are finding it difficult to get fully allocated in the primary market. December will be a quiet month with an expected $30-$35 billion offered, a level that would produce very similar annual issuance as 2022.
Public Sector Watch
Credit Comments
2024 Municipal Issuance Expectations
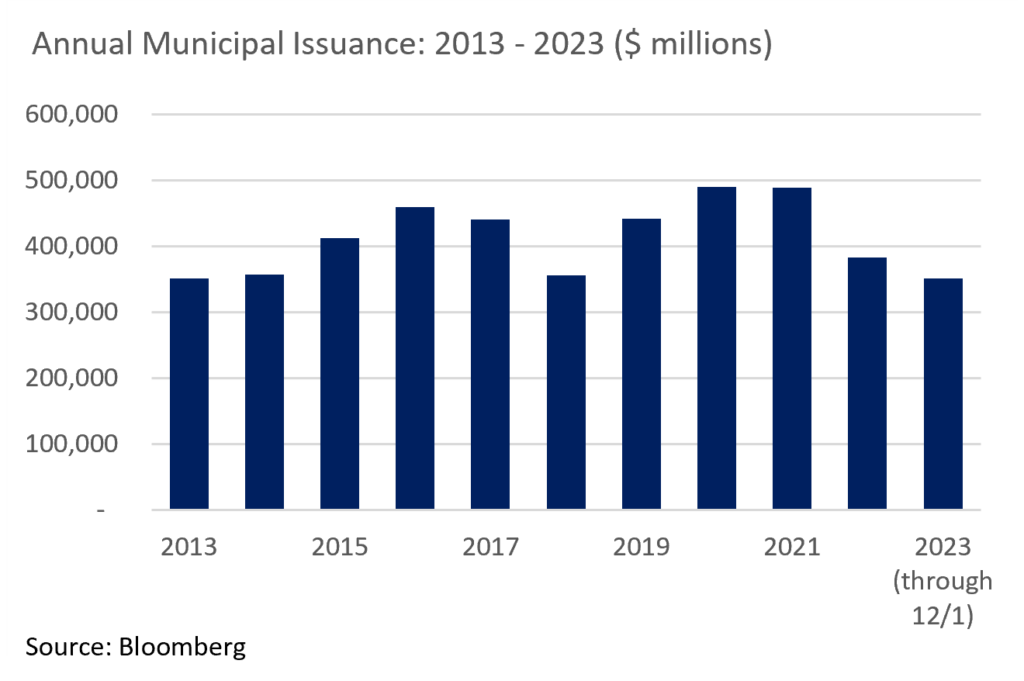
- Eleven months into 2023, municipal bond issuance remains significantly below initial Wall Street expectations. Many analysts had projected YTD issuance to be above $400 billion, with some estimates as high as $500 billion, which would have been a record-breaking year. With rate increases continuing throughout much of 2023, many municipal issuers delayed or altered capital funding plans, resulting in debt issuance lower than expectations. With only a few weeks left, 2023 will end with only approximately $360 million of issuance, a technical factor supportive of bond pricing.
- Many analysts are anticipating 2024 issuance will remain largely in line with 2023 as new supply is not expected to increase materially. While Wall Street estimates vary widely, the majority are expecting issuance of around $400 billion with estimates ranging from $330 billion to $450 billion. By comparison, ten-year average issuance is $417.9 billion.
- Not surprisingly, interest rates are a key consideration of bond issuers and a driver of analyst estimates. With many anticipating rates will remain higher for longer, issuers who can wait for more advantageous rates will likely continue to delay issuance or may scrap plans altogether and pay for projects through internal funding.
- If interest rates decline at a faster pace than currently anticipated, new issuance and refinancings would get a boost. Current refundings have greater interest rate sensitivity than advanced refundings and deal volume of that nature could see an upside surprise.
- Another factor lies in the timing of the election cycle. Some analysts are anticipating reduced issuance due to 2024 being an election year although the data does not support that conclusion. Morgan Stanley reported that there is no evidence that points to a significant front-loading of supply during election years. During the nine election cycles dating back to 1986, 50% of bonds came to market through the second quarter during election years vs. 49% during non-election years. During election years, November and December supply was on average $5 billion lower per month, equal to a 1% delta vs. average historical issuance during the month.
- While estimates vary significantly and there are several factors that influence supply expectation, we continue to closely monitor upcoming issuance and supply expectation given the significant impact it can have on yields and market liquidity.
TSA Travel Volume Reaches Record Levels
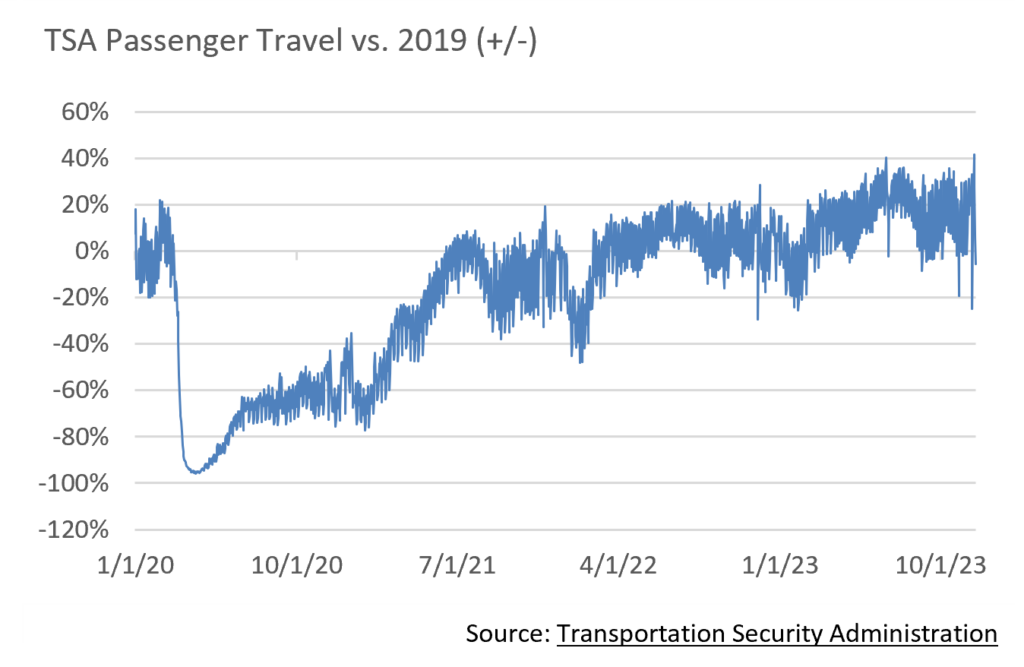
- On November 26th, the Sunday after Thanksgiving, more than 2.9 million travelers passed through US airports, breaking the TSA’s record for the busiest day in its history. This represents a 10.1% increase from the same Sunday last year.
- TSA travel through the first 11 months of 2023 exceeded pre-pandemic levels, a strong indication of economic resiliency. This is clearly a positive for bond issuers as many airports had estimated a full recovery would not occur until 2024 or 2025. Because many airports have budgeted conservatively, we could see positive operating variances and higher profit margins for US airports.
- Many airports also possess substantial liquidity, a factor our Municipal Research team stress tested throughout the pandemic, with a sector average of almost 800 days cash on hand representing an all-time high. This should continue to provide financial flexibility with operations and capital plans as it reduces the need to add debt at higher interest rates.
- We believe there is considerable opportunity in this sector given positive trends in passenger volume. Our credit research process favors large, hub airports along with select regional airports that maintain dominant market positions. We look for issuers with seasoned, capable management and a history of reasonably consistent passenger demand.
Strategy Overview
Composite Portfolio Positioning as of 11/30/2023

Duration Exposure as of 11/30/2023

The composites used to calculate strategy characteristics (“Characteristic Composites”) are subsets of the account groups used to calculate strategy performance (“Performance Composites”). Characteristic Composites excludes any account in the Performance Composite where cash exceeds 10% of the portfolio. Therefore, Characteristic Composites can be a smaller subset of accounts than Performance Composites. Inclusion of the additional accounts in the Characteristic Composites would likely alter the characteristics displayed above by the excess cash. Please contact us if you would like to see characteristics of Appleton’s Performance Composites.
Yield is a moment-in-time statistical metric for fixed income securities that helps investors determine the value of a security, portfolio or composite. YTW and YTM assume that the investor holds the bond to its call date or maturity. YTW and YTM are two of many factors that ultimately determine the rate of return of a bond or portfolio. Other factors include re-investment rate, whether the bond is held to maturity and whether the entity actually makes the coupon payments. Current Yield strictly measures a bond or portfolio’s cash flows and has no bearing on performance.
Our Philosophy and Process
- Our objective is to preserve and grow your clients’ capital in a tax efficient manner.
- Dynamic active management and an emphasis on liquidity affords us the flexibility to react to changes in the credit, interest rate and yield curve environments.
- Dissecting the yield curve to target maturity exposure can help us capture value and capitalize on market inefficiencies as rate cycles change.
- Customized separate accounts are structured to meet your clients’ evolving tax, liquidity, risk tolerance and other unique needs.
- Intense credit research is applied within the liquid, high investment grade universe.
- Extensive fundamental, technical and economic analysis is utilized in making investment decisions.
This commentary reflects the opinions of Appleton Partners based on information that we believe to be reliable. It is intended for informational purposes only, and not to suggest any specific performance or results, nor should it be considered investment, financial, tax or other professional advice. It is not an offer or solicitation. Views regarding the economy, securities markets or other specialized areas, like all predictors of future events, cannot be guaranteed to be accurate and may result in economic loss to the investor. While the Adviser believes the outside data sources cited to be credible, it has not independently verified the correctness of any of their inputs or calculations and, therefore, does not warranty the accuracy of any third-party sources or information. Specific securities identified and described may or may not be held in portfolios managed by the Adviser and do not represent all of the securities purchased, sold, or recommended for advisory clients. The reader should not assume that investments in the securities identified and discussed are, were or will be profitable. Any securities identified were selected for illustrative purposes only, as a vehicle for demonstrating investment analysis and decision making. Investment process, strategies, philosophies, allocations, performance composition, target characteristics and other parameters are current as of the date indicated and are subject to change without prior notice. Registration with the SEC should not be construed as an endorsement or an indicator of investment skill acumen or experience. Investments in securities are not insured, protected or guaranteed and may result in loss of income and/or principal.


