Insights & Observations
Economic, Public Policy, and Fed Developments
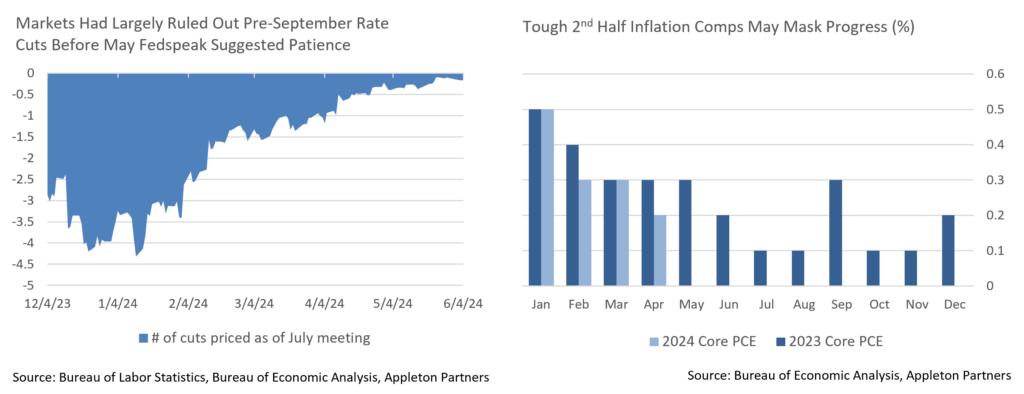
- In some ways the April PCE inflation report, released in late May, was the inverse of February’s; it met the consensus +0.2% mark, but by the barest possible margin. The reported +0.249% was only 0.001% shy of an upside surprise. Still, it technically met expectations, and under the surface, categories continued to trend in the right direction. Services inflation continues to slow and has fallen back to roughly the (encouraging) rate of the second half of last year before the early 2024 blip. If the market was wrong about February, then a positive response to April feels like a restoration of balance.
- This follows earlier improvement in CPI inflation, where headline and core at +0.3% beat by a tenth and were in line, respectively. Improvement was driven by the further slowdown in shelter costs we have been looking for, as well as a drop in the Fed’s preferred services ex-housing “supercore” (which is still too hot but after spiking in the start of the year is now in a downtrend). Core inflation’s annual +3.6% increase now represents the lowest in 3 years.
- That said, progress may be slower from here. The second half of 2023 was a period of benign inflation driven by falling energy prices and supply chain normalization. With low readings dropping out of the trailing year over the summer and fall, improvement will be slow (which the Fed expects; the last “dot plot” foresaw +2.6% core PCE inflation at year-end, only slightly below the current +2.8%). For the remainder of the year, annual rates may be less useful in measuring changes in inflation than 3-month annualized rates as they better compensate for base effects.
- There was an interesting dynamic between weaker than expected retail sales and personal spending, and higher than expected consumer confidence, in April as well. While markets were quick to hypothesize slowing growth, there is a possible alternative explanation. March spending was abnormally strong, boosted by an extremely early Easter holiday and a large Amazon spring sale. Some pullback in spending makes sense; we suggest waiting for May data due out in June before passing judgement.
- Still, a large amount of economic data published in May does suggest a decelerating economy. Notably, the Fed’s “Beige Book” survey reports “slight to moderate” growth in most districts, with Boston and San Francisco reporting flat growth, while the ISM Manufacturing data released on 6/1 showed an unexpected contraction. A larger than anticipated drop in the prices paid component did cause a Treasury rally, however. We’d reiterate slowing is generally good – stripping out net trade and inventory components, strong Q1 growth (that the second revisions tempered only slightly) represents three straight quarters of above trendline demand, and for the Fed to achieve their targeted “soft landing,” growth will likely have to slow slightly from its currently elevated rate.
- Fed speakers garnered a lot of attention in mid-May during an otherwise quiet macro period. Several speakers suggested they would want several more good inflation releases before cutting the Fed Funds Rate, and Neel Kashkari, one of the most dovish members of the FOMC, mentioned at month-end that the Fed hadn’t “entirely ruled out” a rate hike. Context matters here. The market hasn’t priced in more than a 50% chance of a hike before September (by when we’ll have had three more CPI and two more PCE reports) in nearly two months, and Kashkari’s comments are literally true of a data dependent Fed and were probably given more weight by the market than intended.

From the Trading Desk
Municipal Markets
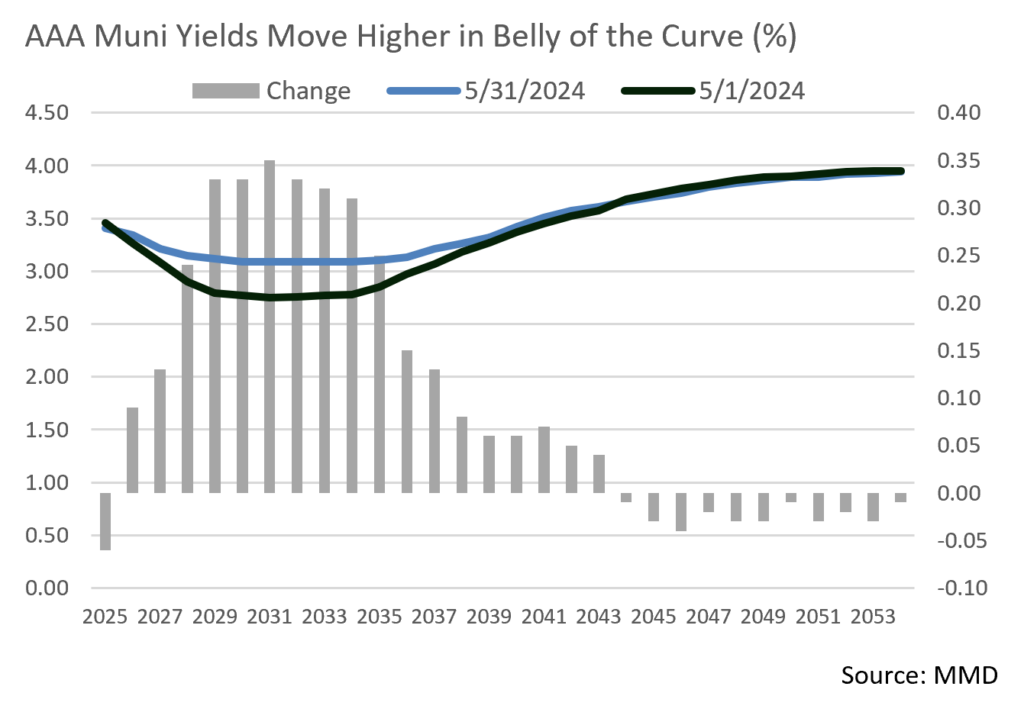
- Municipal yields moved higher over the month with the largest increases in the 5-to-11-year portion of the curve. Yields in the belly of the curve increased by over 30bps, a step towards normalization of what has been an atypical, prolonged inversion. Upward yield pressure largely reflects a surge in new supply and, according to Bloomberg, May’s issuance of $48.9B exceeds the same month of 2023 by 57%. Furthermore, with less than half of 2024 in the books, tax-exempt issuance has already reached 51% of 2023’s full year total.
- May’s yield movement and municipal underperformance vs. USTs drove the AAA 10-year Muni/UST ratio to a more attractive 69.1% at month’s end, the highest it has been since last November. Shorter maturity ratios also showed improved relative value with 2-year and 5-year ratios reaching 68.8% and 69.6%.
- Investor demand has been robust in the high-quality new issuance market due to attractive nominal and tax-equivalent yields, and many offerings have been significantly oversubscribed. On that note, JP Morgan recently released analysis of new issue pricing relative to secondary market yield levels and the results are compelling. Their analysis focused on 5% coupons, AA-rated, non-AMT, 10-year and 30-year bonds over the past 3.5 years. The study found that in the 10-year portion of the curve there has been a consistent incremental spread pick-up of about 13bps when buying new issues relative to similar bonds bought through secondary market trading. At Appleton, we are active in the intermediate parts of the curve and emphasize buying in the primary market due to what is often more attractive relative value, a trading focus supported by JP Morgan’s research.

Corporate Markets
- Investment Grade Credit returns were largely positive in May. The Bloomberg US Corporate Bond Index return of +1.87% marked the best monthly return since 2023’s year-end rally and raised YTD total return to -0.54%. The longer portion of the index fared better (+2.82%) than intermediate maturities (+1.41%), although intermediate duration total return moved back into positive territory (+31 bps) on the year. Long duration remains in the red although the YTD index total return narrowed to -3.90%.
- On a sector basis, Utilities were an outperformer relative to Industrials and Financials as yields receded marginally. Lower quality bond returns were strong in May as credit appetite and a quest for yield remained intact. This dynamic enabled investors with credit exposure to realize positive excess returns.
- Investment Grade credit spreads have been confined to a very narrow range for some time as the QTD wide of 93 bps in mid-April only modestly exceeds a month-end low of 85 bps. Over the course of the year, 20bps of Investment Grade spread compression has produced +1.34% of excess returns, alpha generation from credit we haven’t seen in quite some time as USTs have been the predominant driver of both positive and negative returns.
- High Yield demand remains intact as well despite a slowing economy with spreads moving steadily downward on the month to 308bps on the Bloomberg US Corporate High Yield Bond Index. Credit spread stability appears to be firm and we do not anticipate a significant change over the near term.
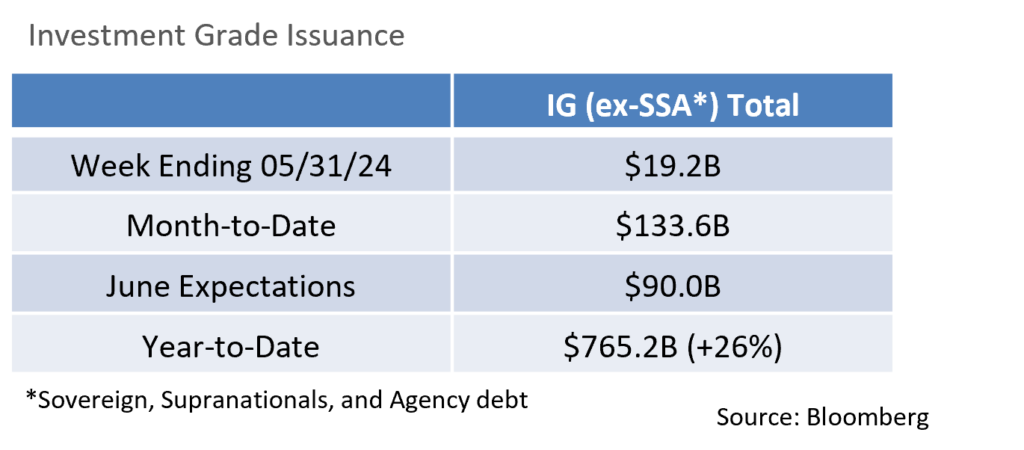
- The Investment Grade primary market began May with projections of $125B of new debt coming to market and those expectations were exceeded with $133.6B ultimately issued. New deals had no problem finding buyers despite some market volatility, and concessions and order books were healthy. Bond redemptions were estimated at close to $100B, which translates into monthly net supply of roughly $33B, a figure investors had no trouble embracing. Supply levels, which are up 26% YoY, are expected to dwindle in the coming months as the seasonality of the summer and the election come into focus, a dynamic that should further support relatively tight credit spreads.

Public Sector Watch
Ratings Changes Reflect a Favorable Credit Environment
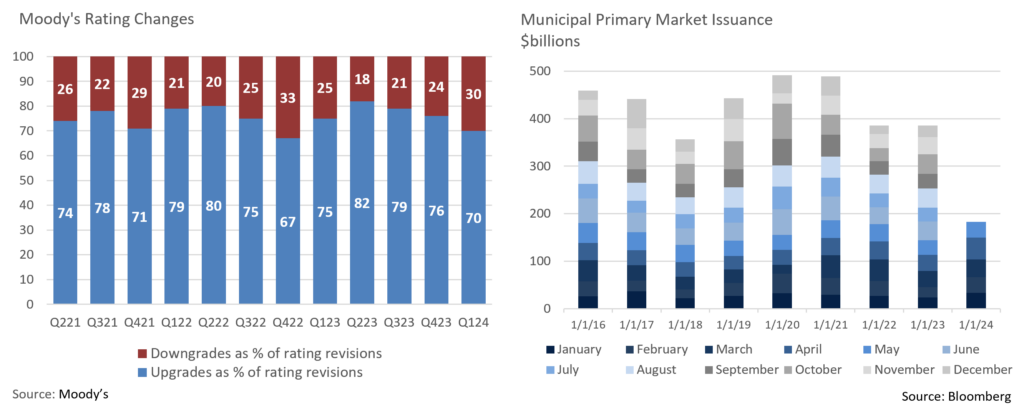
- Moody’s issued 173 rating changes for public finance issuers during Q1 with 121 upgrades outpacing 52 downgrades, a positive 2.3x ratio. This sustains what has been a strong run for municipal credit, marking the 13th consecutive quarter of positive rating actions outnumbering negative ones. Over the last 12 quarters, the upgrade-to-downgrade ratio has averaged 3.2x.
- Nonetheless, underneath the surface, the distribution by sector has been uneven. Not-for-profit healthcare and higher education have lagged, with the latter sector seeing 2 upgrades to 11 downgrades, a credit backdrop due largely to enrollment pressures in a highly competitive student market, leaner operating margins, and narrow liquidity.
- When accounting for the par value of upgrades to downgrades, $58.6B of total debt was upgraded while $12.0B was downgraded, a more favorable ratio of 4.9x. This is indicative of large, diverse, municipalities with ample resources and more debt outstanding being upgraded, while some smaller municipalities with more limited resources were downgraded, supporting Appleton’s preference to invest in larger, well-known names.
Healthcare Leads a Surge In Tax-Exempt Issuance
- At the beginning of the year, consensus among sell side analysts was for primary market municipal issuance to remain flat to slightly above 2023 levels of $379B. Through the end of May, new supply has greatly exceeded expectations with issuance of $182B increasing 26.6% YoY. Visible supply, a gauge of what’s coming to market over the next 30 days, stands at $18.5B according to Bloomberg, the highest it’s been since May of 2022 when it was $19.3B.
- While issuance has been strong across nearly all sectors, healthcare has led the way with $12.8B coming to market on a YTD basis. Strong healthcare issuance is expected to continue, and during the first week of June alone three healthcare systems – Advent Health, Intermountain, and Memorial Hermann Healthcare – are expected to offer $1.3B of new debt. Yale New Haven Health is also expected to issue $670M of debt in June, a development that would enable healthcare issuance through June to exceed that of all of 2023. These issuers are all approved by Appleton’s Municipal Research team.
- An uptick in healthcare issuance reflects a very challenging 2023 operating environment as significant expense increases were paired with slower revenue growth and a lack of additional federal pandemic aid. Margins compressed accordingly leading to decreased capital spending. Many healthcare systems have proactively taken steps to solidify their balance sheets and operating performance and are now in a better position to offer new debt.
- Other factors that have led to a broader increase in primary market volume include lower tax-exempt borrowing costs relative to taxable bond yields prompting ERP BAB calls and taxable tenders; a pull forward of issuance ahead of the November election; funding from COVID-era packages including the Infrastructure Investment Act; and the compounding impact of inflation on project costs.
- We welcome increased new bond offerings as it helps alleviate a supply and demand imbalance that has compressed Muni/UST ratios and made accessing bond supply challenging at times. The importance of proprietary research remains paramount though as issuer specific credit standing varies considerably.

Composite Portfolio Positioning (As of 5/31/24)
Strategy Overview

Duration Exposure (as of 5/31/24)

The composites used to calculate strategy characteristics (“Characteristic Composites”) are subsets of the account groups used to calculate strategy performance (“Performance Composites”). Characteristic Composites excludes any account in the Performance Composite where cash exceeds 10% of the portfolio. Therefore, Characteristic Composites can be a smaller subset of accounts than Performance Composites. Inclusion of the additional accounts in the Characteristic Composites would likely alter the characteristics displayed above by the excess cash. Please contact us if you would like to see characteristics of Appleton’s Performance Composites.
Yield is a moment-in-time statistical metric for fixed income securities that helps investors determine the value of a security, portfolio or composite. YTW and YTM assume that the investor holds the bond to its call date or maturity. YTW and YTM are two of many factors that ultimately determine the rate of return of a bond or portfolio. Other factors include re-investment rate, whether the bond is held to maturity and whether the entity actually makes the coupon payments. Current Yield strictly measures a bond or portfolio’s cash flows and has no bearing on performance.
Our Philosophy and Process
- Our objective is to preserve and grow your clients’ capital in a tax efficient manner.
- Dynamic active management and an emphasis on liquidity affords us the flexibility to react to changes in the credit, interest rate and yield curve environments.
- Dissecting the yield curve to target maturity exposure can help us capture value and capitalize on market inefficiencies as rate cycles change.
- Customized separate accounts are structured to meet your clients’ evolving tax, liquidity, risk tolerance and other unique needs.
- Intense credit research is applied within the liquid, high investment grade universe.
- Extensive fundamental, technical and economic analysis is utilized in making investment decisions.
This commentary reflects the opinions of Appleton Partners based on information that we believe to be reliable. It is intended for informational purposes only, and not to suggest any specific performance or results, nor should it be considered investment, financial, tax or other professional advice. It is not an offer or solicitation. Views regarding the economy, securities markets or other specialized areas, like all predictors of future events, cannot be guaranteed to be accurate and may result in economic loss to the investor. While the Adviser believes the outside data sources cited to be credible, it has not independently verified the correctness of any of their inputs or calculations and, therefore, does not warranty the accuracy of any third-party sources or information. Any securities identified were selected for illustrative purposes only, as a vehicle for demonstrating investment analysis and decision making. Investment process, strategies, philosophies, allocations, performance composition, target characteristics and other parameters are current as of the date indicated and are subject to change without prior notice. Not all products listed are available on every platform and certain strategies may not be available to all investors. Financial professionals should contact their home offices. Registration with the SEC should not be construed as an endorsement or an indicator of investment skill acumen or experience. Investments and insurance products are not FDIC or any other government agency insured, are not bank guaranteed, and may lose value.


