Insights & Observations
Economic, Public Policy, and Fed Developments
- Three major themes emerged in June that we believe will be critical over the summer and fall; solidified improvement in inflation, growing evidence of a softening economy, and renewed political risk. We will address all three.
- Both CPI and PCE inflation releases were stellar in June. CPI beat by a tenth in both headline and core; the only source of inflation in May was shelter (which is a lagged calculation.) Core services ex-shelter turned negative and falling energy costs detracted almost exactly as much as shelter added at the headline. We do not expect energy improvements to be persistent, but negative core services ex-shelter is a welcome development for the Fed.
- CPI shifted market expectations enough that PCE was merely in-line, but nonetheless the release was excellent. Headline inflation was actually negative to full decimal precision, and while “supercore” was slightly positive, unlike in CPI, the +0.096% was the best reading we’ve seen in, August 2023 aside, nearly four years. The next few months will have tough comps, so the current +2.6% headline and core may rise slightly before year-end. But our belief that early 2024 inflation would prove to be an anomaly is being borne out by the data.
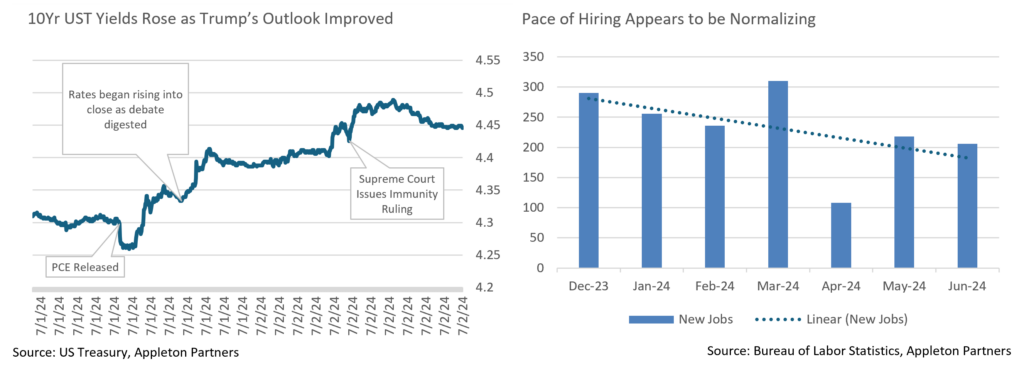
- Second, while we’d stress this is still consistent with a “soft landing,” the bulk of evidence now points to a slowing economy. The labor market has certainly cooled – May’s jobs report may have initially shown a robust 272k new jobs (exceeding the consensus 180k), but while the June release beat modestly at 206k vs. 190k, it also brought 111k in prior downward revisions, lowering May to a closer-to-consensus 218k. The unemployment rate ticked up to 4.1%, as well, and a perceptible cooling trend in hiring over the spring is evident.
- Cooling extended beyond the labor market. ISM Services and Manufacturing both modestly contracted, and durable goods orders were a little weak (although a widespread car dealer software hack at month end may have had an impact). The combination of slightly weaker than expected reports has begun to weigh on growth forecasts – the Atlanta Fed’s GDPNow nowcast fell from over +3% in mid-June to +1.5% as of July 3rd. This may ultimately have overshot a little, given some of the inventory effects from Q1, but in aggregate, it looks like the economy is probably no longer exceeding trendline growth.
- Finally, political turmoil came to the forefront in late June, after President Biden’s disastrous debate performance on the 27th threw his campaign into turmoil. Friday afternoon saw a run-up in rates and the 10Yr ultimately closed 15bps higher than the lows of the day. A number of research notes on Monday suggested it might be the markets pricing in the likelihood of a Trump win, and with it higher inflation from his proposed heavy tariffs, immigration constraints, and a more politically accommodative Fed; the immediate 6bps jump in Treasury yields on the news the Supreme Court ruled Trump may have some immunity from prosecution for “official acts” (a decision effectively closing the window to hear pending criminal cases against Trump before the election) gives credence to this theory.
- Combined, we see the stage set for volatility in the second half of 2024. The progress against inflation and cooling labor market should, absent any surprises, give the Federal Reserve cover to begin cutting rates as early as September. However, growing Democratic calls for President Biden to step down make it very hard to predict the path of the election, and with it, future fiscal policy. Sudden developments could easily pull the equity and rates market well away from fundamental value in this highly charged environment.

From the Trading Desk
Municipal Markets
- Municipal yields moved lower by 14 to 20bps during June, with smaller moves between 2029 and 2031 maturities and larger ones on the tails of our buying range. The curve remains inverted, as it has been for the entirety of 2024, with the spread between 2s to 10s at -21 bps. The persistency of curve inversion has enabled us to pick up incremental yield on shorter maturities while still maintaining duration targets by complementing this exposure farther out on the curve in a barbell structure.
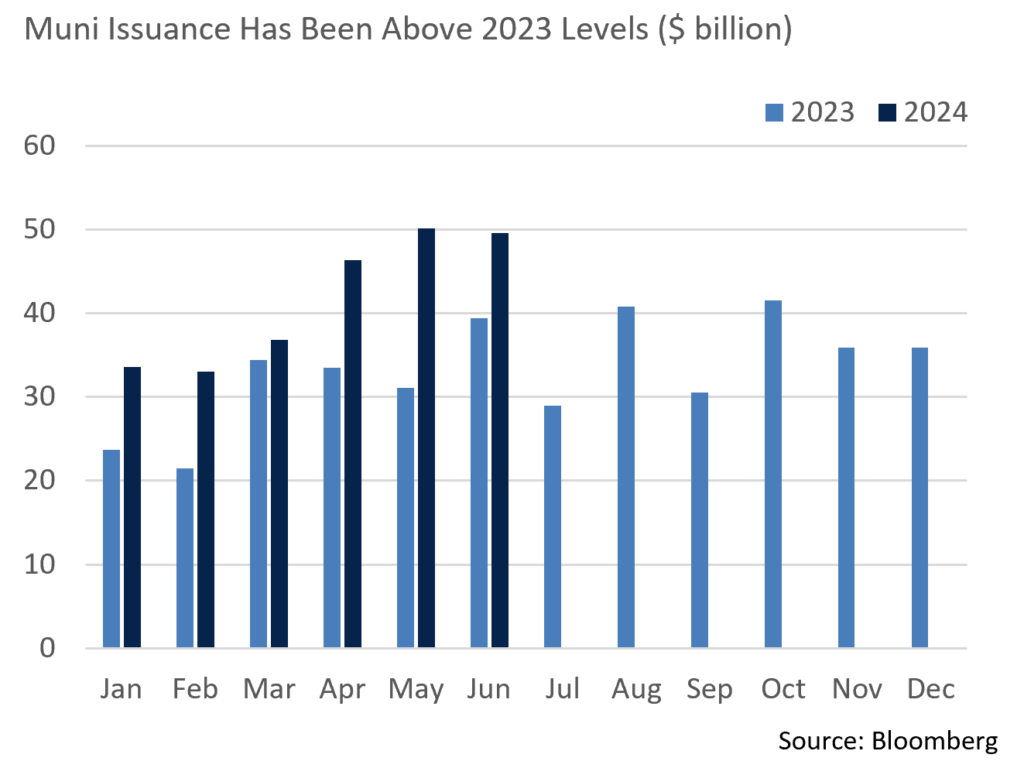
- New municipal supply remained strong through quarter-end with Bloomberg reporting total quarterly issuance of more than $146 billion, 40% higher than the same period last year. We believe this phenomenon reflects issuers trying to front run expected election related market volatility. Heightened issuance is likely to be sustained, particularly in September and October ahead of election day.
- A surge in issuance has been met with significant demand by tax-exempt investors. July and August are historically periods of strong technical support for municipals given the volume of bonds that are maturing or are being called and thus will need to be reinvested. According to Bloomberg, July net negative supply has reached $12.6 billion and is expected to increase as we progress through the month. The recent record for largest net negative supply in July was -$29 billion in 2020. While we do not anticipate exceeding that level, favorable technicals should keep municipal yields tight.

Corporate Markets
- June’s Investment Grade Corporate new issuance guidance of $90 billion was easily exceeded by the $102 billion of new debt that ultimately came to market. The last week in June ended with $32 billion of issuance ahead of the July 4th holiday and a typical July slowdown due to Q2 earnings blackouts. Issuers paid higher concessions as the month ended, although demand remained solid with average order books 3.4x oversubscribed. Spread compression on deals was about 25bps as they started trading in the secondary market. Single A bonds represented 37% of monthly volume and 43% YTD. The Financial sector has been the largest issuer, accounting for 42% of YTD volume.
- On a YTD basis, $867 billion of Investment Grade Corporate bonds have been sold in the primary market, the second highest total since $1.2 trillion was offered during the COVID-influenced first half of 2020. Consensus for 2024 new supply remains in the $1.2 trillion range although we anticipate a slowdown as the presidential election approaches and given the potential for an initiation of FOMC short-term rate cuts. A slower primary market would put downward pressure on already relatively tight credit spreads in a market that is not lacking for demand.
- For the third straight month, Investment Grade Corporate bonds had positive returns with a 0.64% gain on the Bloomberg US Corporate Bond Index raising YTD performance to -0.49%. Longer bonds continued to struggle to keep pace with the intermediate portion of the curve. We continue to favor intermediate duration and high-quality names as more signs of a slowing economy become evident.
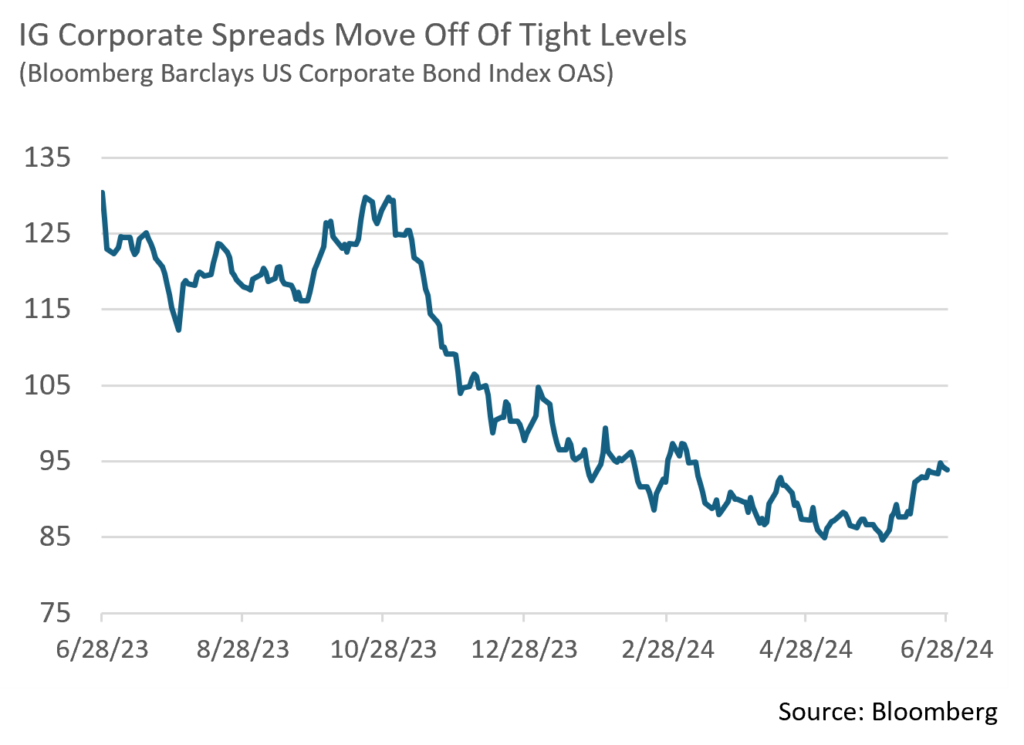
- Investment Grade spreads moved higher in June as a risk-off tone took hold for the first time in several months. The 9bps of spread widening on the Index brought the OAS to 94bps, a level that hasn’t been seen since mid-March. We do not see this as a warning sign or particularly alarming in absolute terms or relative to historical norms. The market in our view is simply recalibrating at the margin as economic data and technical factors develop. June’s modest widening reinforces our belief that IG spreads are likely to remain locked in a relatively narrow range for the time being.

Public Sector Watch
State Credit Conditions Remain Strong
- The National Association of State Budget Officers released their annual Spring Survey, a collection of data that focuses on current fiscal year (FY24) and upcoming FY25 budgets. State credit conditions generally remain strong although the drivers of that strength have shifted.
- Federal pandemic aid and strong revenue collections boosted financial coffers and spending ability over recent years; however, a shift in the cycle is evident. Over the last 12-18 months revenues have slowed yet reserves and balance sheet strength largely remain robust. Conservative budgeting and a prudent reluctance to establish recurring programs during the boom years are the predominant reasons for the financial resilience of most issuers.
- Given the fact that states provide downstream funding for many entities in the municipal market such as cities, school districts, public higher education, and transportation agencies, state credit quality is a good proxy for the overall market. There will always be one-off municipalities struggling, but broadly speaking, municipal credit quality remains strong, supported by economic resiliency, historically large reserves, and an ability and willingness to adjust budgets to the revenue environment.
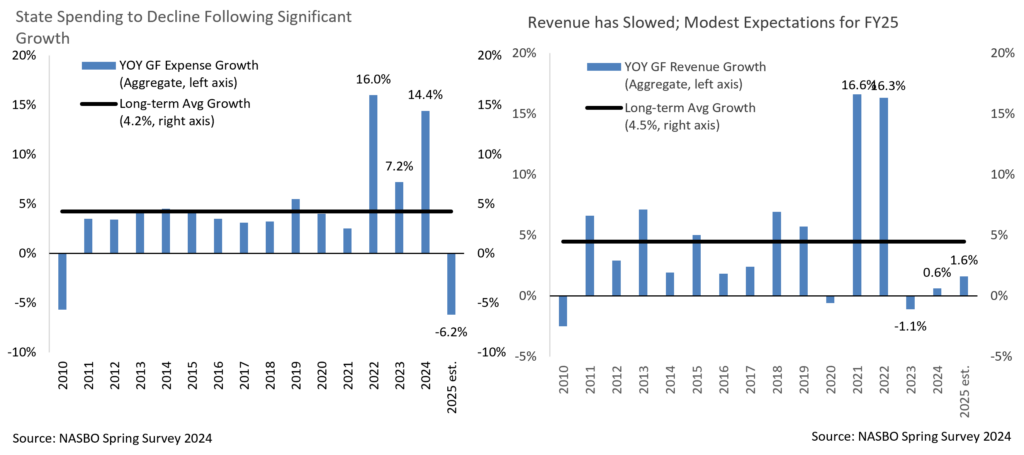
- As windfall revenues and one-time aid is spent, expenses are “normalizing.” Median proposed FY25 spending is expected to decelerate to +1.1% YoY from +10.3% in FY23 and +7.6% in FY24. Significant spending in FY23 and FY24 largely reflects utilization of pandemic aid and windfall revenue collections from economic reopening.
- Total spending across all states is expected to decline by 6.2% in FY25 (vs. the median growth previously referenced), although significant cuts by California somewhat skews the data. Nonetheless, spending restraint is evident in most states.
Budget Officers Remain Cautious on Revenue Expectations
- Revenue growth has also normalized following the reopening surge, with a -1.1% decline in FY23, +0.6% growth in FY24, and a budgeted +1.6% increase for FY25.
- Reflecting budgeting conservatism, 33 states reported that FY24 revenues are exceeding their original projections despite a smaller than expected growth rate of +0.6%. Ten states noted that revenues trail projections, California among them.
- Management prudency is also reflected in an infrequent need to make mid-year budget reductions, a consistent trend since 2020. Only 3 states had to make FY24 adjustments compared to an average of 9 states annually over the prior decade.
Ample Reserves Create Budgetary Flexibility
- Given a recent cycle of budget surpluses, most states have not needed to tap into reserves, and many have added to them. As a result, the median rainy-day fund is expected to reach 15.0% of spending in 2025, up from 7.9% pre-pandemic (2019) and significantly higher than the 4.4% average from 2010-2019. These sizeable reserves greatly enhance the fiscal options available to management.

Composite Portfolio Positioning (As of 6/30/24)
Strategy Overview

Duration Exposure (as of 6/30/24)

The composites used to calculate strategy characteristics (“Characteristic Composites”) are subsets of the account groups used to calculate strategy performance (“Performance Composites”). Characteristic Composites excludes any account in the Performance Composite where cash exceeds 10% of the portfolio. Therefore, Characteristic Composites can be a smaller subset of accounts than Performance Composites. Inclusion of the additional accounts in the Characteristic Composites would likely alter the characteristics displayed above by the excess cash. Please contact us if you would like to see characteristics of Appleton’s Performance Composites.
Yield is a moment-in-time statistical metric for fixed income securities that helps investors determine the value of a security, portfolio or composite. YTW and YTM assume that the investor holds the bond to its call date or maturity. YTW and YTM are two of many factors that ultimately determine the rate of return of a bond or portfolio. Other factors include re-investment rate, whether the bond is held to maturity and whether the entity actually makes the coupon payments. Current Yield strictly measures a bond or portfolio’s cash flows and has no bearing on performance. For calculation purposes, Appleton uses an assumed cash yield which is updated on the last day of each quarter to match that of the Schwab Municipal Money Fund.
Our Philosophy and Process
- Our objective is to preserve and grow your clients’ capital in a tax efficient manner.
- Dynamic active management and an emphasis on liquidity affords us the flexibility to react to changes in the credit, interest rate and yield curve environments.
- Dissecting the yield curve to target maturity exposure can help us capture value and capitalize on market inefficiencies as rate cycles change.
- Customized separate accounts are structured to meet your clients’ evolving tax, liquidity, risk tolerance and other unique needs.
- Intense credit research is applied within the liquid, high investment grade universe.
- Extensive fundamental, technical and economic analysis is utilized in making investment decisions.
This commentary reflects the opinions of Appleton Partners based on information that we believe to be reliable. It is intended for informational purposes only, and not to suggest any specific performance or results, nor should it be considered investment, financial, tax or other professional advice. It is not an offer or solicitation. Views regarding the economy, securities markets or other specialized areas, like all predictors of future events, cannot be guaranteed to be accurate and may result in economic loss to the investor. While the Adviser believes the outside data sources cited to be credible, it has not independently verified the correctness of any of their inputs or calculations and, therefore, does not warranty the accuracy of any third-party sources or information. Any securities identified were selected for illustrative purposes only, as a vehicle for demonstrating investment analysis and decision making. Investment process, strategies, philosophies, allocations, performance composition, target characteristics and other parameters are current as of the date indicated and are subject to change without prior notice. Not all products listed are available on every platform and certain strategies may not be available to all investors. Financial professionals should contact their home offices. Registration with the SEC should not be construed as an endorsement or an indicator of investment skill acumen or experience. Investments and insurance products are not FDIC or any other government agency insured, are not bank guaranteed, and may lose value.


