


A Look at the Relationship Between Starting Yield and Total Return
Today’s Conditions Offer Clues About Tomorrow
News cycles and market sentiment shifts have become increasingly rapid in today’s fast paced media environment. Depending on where one turns for insight (or opinion as the case may be), recommendations are likely to widely vary, if not conflict. Financial markets are inherently uncertain and what ends up influencing short term investment performance is often unclear at any given moment. Nonetheless, certain fundamentals are worthy of emphasis, including the importance of starting bond yield on expected future total return.
In simple terms, yield is the income earned on the capital invested in a bond. Yield and price are inversely related and factors such as credit quality, supply and demand, and yield curve structure, among others, can impact a bond’s price. Yet over the long run, yield levels at the time you buy a bond or invest in a fixed income portfolio is the predominant driver of expected total return, particularly in the investment grade markets.
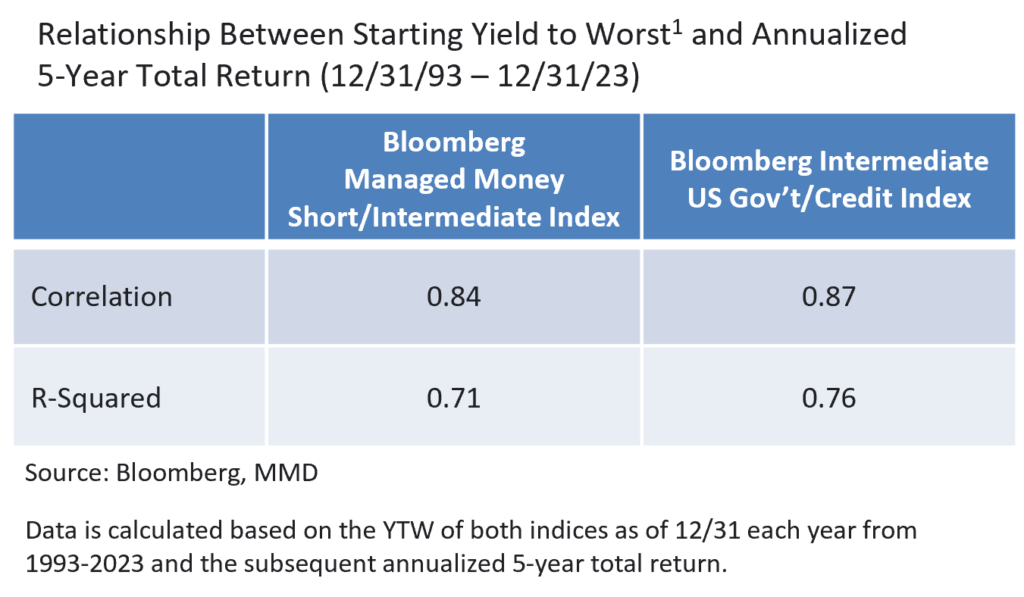
Correlation measures the extent to which two variables are linked and is calculated as a directional linear relationship, with 1.0 and -1.0 representing perfect positive and negative associations, respectively. However, correlation is not the same thing as causation, and variables may be directionally linked even though one does not directly influence the other. Therefore, let’s also look at R-Squared, a statistical measure that goes a step further by calculating the proportion of variation in the value of the dependent variable (in this case future total return) that can be attributed to the independent variable (starting bond yield). R-Squared is calculated by regressing the values of each of the two variables over a stated time period, with values falling between 0 and 1 (higher numbers indicating a stronger ability of one variable to influence the other).
The accompanying chart demonstrates a close relationship in both the municipal and investment grade taxable fixed income markets between starting yield (as measured by yield to worst) and subsequent five-year total return. Correlation levels of 0.84 and 0.87, and R-Squared values above 0.70 measured over 30 years of data reinforce the significance of starting bond yield on future total return expectations.
The Roots of Future Performance Expectations
Consider where we’ve been relative to where things stand as the second half of 2024 begins. Four years ago, the bellwether 10Yr UST bond yielded roughly 0.70%, whereas the same bond on 6/30/24 yielded 4.36%. Quite simply, the total return outlook of the bond portion of a municipal or taxable balanced portfolio has become far more favorable. Turning to our strategies, the Yield to Worst1 on Appleton’s High Grade Intermediate Gov’t/Credit strategy was 4.92% as of 6/30/24, while it sat at 3.16% on Intermediate Municipal. The Yield to Maturity on these two strategies as of the same date were 3.45% and 4.94%, respectively. These yield levels offer a very constructive foundation for balanced or fixed income strategies, particularly in comparison to recent years.
Appleton’s investment process emphasizes active management as we seek to identify and capitalize on relative value opportunities in dynamic markets among a diversity of credits. As a result, most of our clients’ portfolios are not static and total return will be influenced by more than one factor over the long run. Nonetheless, starting yield represents a powerful influence on future performance and today’s environment in our view is quite favorable. How municipal and/or taxable bonds may fit into one’s asset allocation strategy is a question that our Portfolio Managers consider in consultation with each client, yet looking forward, things are looking up for bond investors.
- Yield to Worst is the lowest yield that can be received on a bond with an early retirement or call provision.
Yield is a moment-in-time statistical metric for fixed income securities that helps investors determine the value of a security, portfolio or composite. YTW and YTM assume that the investor holds the bond to its call date or maturity. YTW and YTM are two of many factors that ultimately determine the rate of return of a bond or portfolio. Other factors include re-investment rate, whether the bond is held to maturity, and whether the entity actually makes the coupon payments. Current Yield strictly measures a bond or portfolio’s cash flows and has no bearing on performance. For calculation purposes, Appleton uses an assumed cash yield which is updated on the last day of each quarter to match that of the Schwab Municipal Money Fund.
This commentary reflects the opinions of Appleton Partners based on information that we believe to be reliable. It is intended for informational purposes only, and not to suggest any specific performance or results, nor should it be considered investment, financial, tax or other professional advice. It is not an offer or solicitation. Views regarding the economy, securities markets or other specialized areas, like all predictors of future events, cannot be guaranteed to be accurate and may result in economic loss to the investor. While the Adviser believes the outside data sources cited to be credible, it has not independently verified the correctness of any of their inputs or calculations and, therefore, does not warranty the accuracy of any third-party sources or information. Specific securities identified and described may or may not be held in portfolios managed by the Adviser and do not represent all of the securities purchased, sold, or recommended for advisory clients. The reader should not assume that investments in the securities identified and discussed are, were or will be profitable. Any securities identified were selected for illustrative purposes only, as a vehicle for demonstrating investment analysis and decision making. Investment process, strategies, philosophies, allocations, performance composition, target characteristics and other parameters are current as of the date indicated and are subject to change without prior notice. Registration with the SEC should not be construed as an endorsement or an indicator of investment skill acumen or experience. Investments in securities are not insured, protected or guaranteed and may result in loss of income and/or principal.