Insights & Observations
Economic, Public Policy, and Fed Developments
- The biggest October economic news came on the first of November, when October’s jobs report showed a mere 12k jobs created that month. While abysmal on the surface, we recommend interpreting the jobs report with caution for three reasons.
- The easiest to quantify is the ongoing Boeing strike. While BLS did not name names, they noted strike activity was responsible for a detraction of -44k from “transportation equipment manufacturing.”
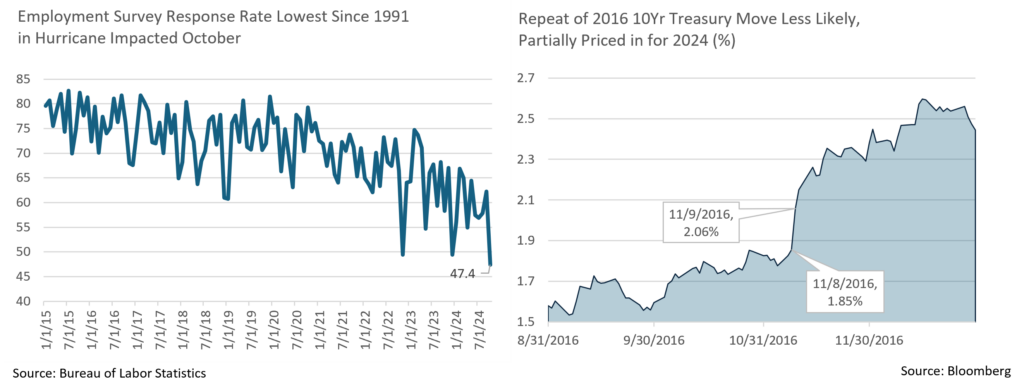
- Two hurricanes in rapid succession impacted the numbers as well, though this is harder to directly quantify; BLS notes that employment levels were impacted, though not the unemployment rate (which suggests the modest drop in labor participation was also storm related). Notably, the lowest response rate since 1991 implies this report’s accuracy has also been affected by a smaller sample size, setting up potential for larger revisions in the next two months.
- Finally, while BLS made no mention of a close presidential race, recent business surveys have indicated companies are deferring hiring and capital investment until after the election, when fiscal policy will be more certain. This undoubtedly depressed hiring as well.
- In all three cases, October weakness can reasonably be expected to reverse in coming months. The 112k in downward prior revisions are a more concrete sign of softness, but for the most part revised numbers aren’t worryingly weak, and in any event, a moderation in labor demand was the Fed’s intended outcome. We expect the FOMC to look through this report.
- The Q3 GDP report, while strong, was even stronger than it looked. Headline was a solid +2.8%, but with detractions from net trade and inventory drawdown, personal consumption was a whopping +3.7%. Final sales to domestic purchasers was +3.5%, and +3.2% ex-government. This was after excellent October retail sales data, and the biggest uptick in consumer confidence since May 2021. Most of the movement in the Confidence Survey was driven by the “current situation” sub-index, and confidence in job availability improving. Overall, growth looks robust at the start of Q4.
- Treasury indices posted their worst return in over two years in October as yields surged. Positive economic data may have been to blame, and the move aligns well with an upward move in Bloomberg’s estimation of the long run neutral interest rate to 3.6%, which we see as far more reasonable than the pre-FOMC meeting 2.9%. However, it also came at a time when betting markets saw an increased likelihood of a Trump win. The “Trump trade” this summer was higher yields as the Biden campaign faltered. In 2016, while the post-election equity pop is well-remembered, there was also a corresponding spike in Treasury yields; yields could rise further should Trump win; this possibility appears to be better priced in now than it was 8 years ago although post-election yield volatility is likely regardless.
- With both candidates likely to increase US deficits, in the long term we see the curve steepening regardless of the winner. One factor that could depress them in the medium term is, paradoxically, the US hitting the debt ceiling on January 2nd. Unable to issue new debt, the Treasury will spend out of their General Account, which since the beginning of QE is held at the Fed outside of the depository system. This technically represents an influx of fresh liquidity into the US banking system. With estimates of the start-of-year TGA balance nearly $700 billion, adequate to fund operations through August, this could be a tailwind in the first half of 2025.

From the Trading Desk
Municipal Markets
- The first week of November could be a roller coaster for municipal investors. All eyes will be on the Presidential election followed by the November Fed meeting on Wednesday and Thursday. The Fed meeting was adjusted from the typical Tuesday and Wednesday schedule due to the election. The Fed will release its Fed Funds rate decision on Thursday and CME FedWatch futures currently point to a near certainty of a 0.25% decrease.
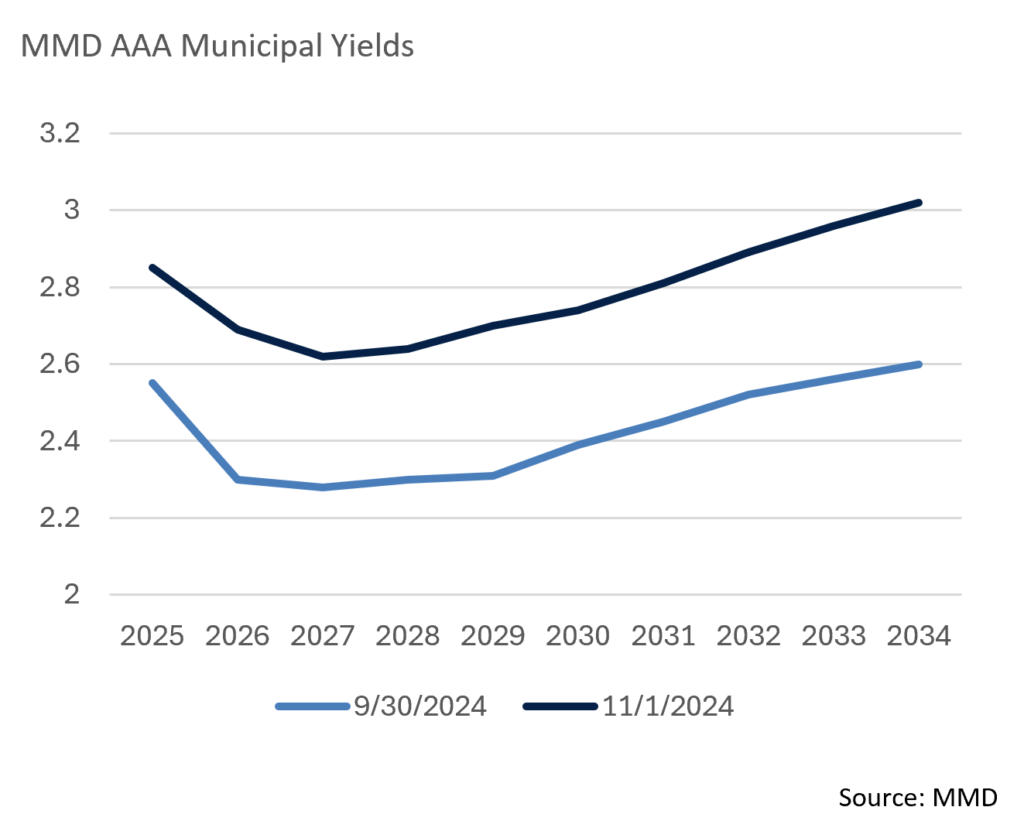
- Over the course of the month, municipal yields moved higher in close to a parallel shift. The 2-year AAA bond was up by 39 bps and 10-year yields increased by 42 bps. This felt like a buying opportunity for many investors looking for yield and demand has remained robust. Given that Treasury yields also moved higher in October, the 10-year AAA Muni/UST ratio remained stable on a month-to-month basis at about 69%. We expect ratios to remain in this range for the foreseeable future, despite it being below long-term averages.
- Supply continues to be robust, as it has been throughout the year. According to BofA Securities, YTD issuance is 38% above last year. Bloomberg data reports that October issuance was the highest of the year by a significant margin at $66.2 billion, a function in part of issuers getting ahead of potential election volatility. The Bond Buyer 30-Day Visible Supply indicator is at a near-term low of just $3.7 billion given that very limited new supply is forthcoming this week and next. Once the market digests the election results, as well as a likely Fed Funds rate cut, we expect issuance to return.

Corporate Markets
- US Treasury yields moved significantly higher in October and the shape of the curve flattened, erasing what had been a sizeable trough between very short maturities and the intermediate part of the yield curve. As the month began, the inversion between 1Yr and 10Yr USTs was -24bps, yet that same range closed October with a positive 1bp differential as short yields fell slightly, and intermediate yields moved higher on stronger economic data. The lowest yielding points along the curve this year have continuously been the 3Yr to 5Yr range and last month’s sell off drove up 5Yr UST yields 60bps to the highest level since July 2024.
- While UST yields rose, putting pressure on fixed income performance, Investment Grade credit spreads remained incredibly resilient. The 80bps OAS recorded on October 17th was the lowest so far this year and since August 2021. The lowest point in the last 10 years was a 53bps print back in March 1997. While we do not expect credit spreads to fall to those very tight levels anytime soon, we feel they will be range-bound over the near term with demand remaining exceptionally strong.
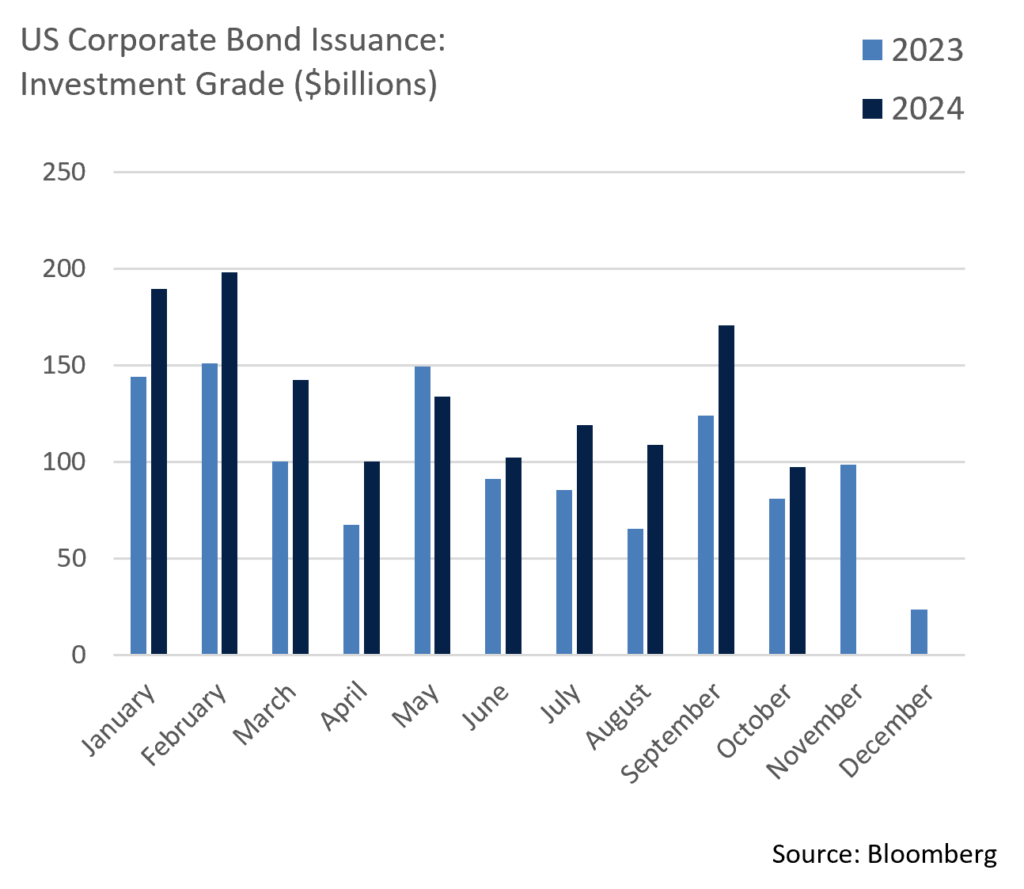
- The primary market continues to be supported by eager investors looking to lock in higher yields for longer. This month’s $97.5 billion of issuance beat the market consensus of $97 billion, although this was the first time this year that monthly issuance failed to exceed $100 billion. November issuance is also projected to be slower than usual due to the Presidential election and the Fed Funds rate announcement. Market consensus for November is roughly $70 billion, which doesn’t come close to filling the gap of an estimated $100 billion in monthly redemptions, a technical factor that should be supportive of IG credit. We expect sluggish new supply to continue over the balance of 2024.

Public Sector Watch
2024 Ballot Measures and their Potential Impact on State Credit
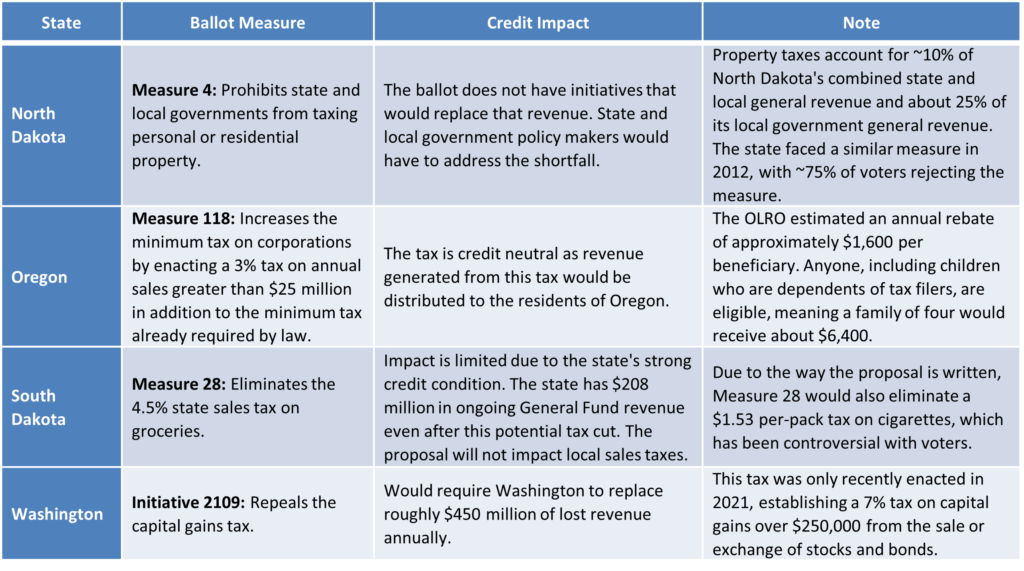
On November 5th, voters in 41 states will decide on nearly 150 statewide ballot measures. Although not receiving top billing in the media, these measures can have an important impact on state and local credit trends, as voter support (or lack thereof) can alter tax collection trends and/or spending mandates. Below we highlight ballot measures of note.

Bond Authorizations Reflect Solid Levels of New Borrowing
Voters in four states will decide on nearly $20.7 billion of bond issuance this fall. Bond authorization approvals are meaningful as they can be an indicator of future municipal issuance. It is likely voters will approve these bond authorizations, as in the past 15 years states put 128 bond measures on their ballots and voters have approved all but nine of them.
California Propositions 2 and 4: Authorizes $20 billion in bonds to fund construction and modernization of public education facilities and various environmental, energy, and water projects.
Maine Questions 2-4: Authorizes a combined $65 million in bonds including $25 million for technological innovation and $30 million for the development and maintenance of outdoor trails, among other initiatives.
New Mexico Questions 1-4: Issues $290.7 million of bonds with the majority being used to fund public higher education institutions, special public schools, and tribal schools.
Rhode Island Questions 2-5: Authorizes $343.5 million of bonds, including $160.5 million for improvements to higher education facilities, and $120 million to increase the availability of housing, among other uses.
On a local level, municipalities have 177 bond measures on the ballot totaling approximately $38 billion across 15 states. Of these local ballot measures, 128 are school bond proposals. Inclusive of both state and local ballot initiatives, bond authorizations total over $70 billion, one of the largest years in recent history. This points to continued strong municipal issuance in 2025, which could help boost new tax-exempt supply.
Composite Portfolio Positioning (As of 10/31/24)
Strategy Overview

Duration Exposure

The composites used to calculate strategy characteristics (“Characteristic Composites”) are subsets of the account groups used to calculate strategy performance (“Performance Composites”). Characteristic Composites excludes any account in the Performance Composite where cash exceeds 10% of the portfolio. Therefore, Characteristic Composites can be a smaller subset of accounts than Performance Composites. Inclusion of the additional accounts in the Characteristic Composites would likely alter the characteristics displayed above by the excess cash. Please contact us if you would like to see characteristics of Appleton’s Performance Composites.
Yield is a moment-in-time statistical metric for fixed income securities that helps investors determine the value of a security, portfolio or composite. YTW and YTM assume that the investor holds the bond to its call date or maturity. YTW and YTM are two of many factors that ultimately determine the rate of return of a bond or portfolio. Other factors include re-investment rate, whether the bond is held to maturity and whether the entity actually makes the coupon payments. Current Yield strictly measures a bond or portfolio’s cash flows and has no bearing on performance. For calculation purposes, Appleton uses an assumed cash yield which is updated on the last day of each quarter to match that of the Schwab Municipal Money Fund.
This commentary reflects the opinions of Appleton Partners based on information that we believe to be reliable. It is intended for informational purposes only, and not to suggest any specific performance or results, nor should it be considered investment, financial, tax or other professional advice. It is not an offer or solicitation. Views regarding the economy, securities markets or other specialized areas, like all predictors of future events, cannot be guaranteed to be accurate and may result in economic loss to the investor. While the Adviser believes the outside data sources cited to be credible, it has not independently verified the correctness of any of their inputs or calculations and, therefore, does not warranty the accuracy of any third-party sources or information. Any securities identified were selected for illustrative purposes only, as a vehicle for demonstrating investment analysis and decision making. Investment process, strategies, philosophies, allocations, performance composition, target characteristics and other parameters are current as of the date indicated and are subject to change without prior notice. Not all products listed are available on every platform and certain strategies may not be available to all investors. Financial professionals should contact their home offices. Registration with the SEC should not be construed as an endorsement or an indicator of investment skill acumen or experience. Investments and insurance products are not FDIC or any other government agency insured, are not bank guaranteed, and may lose value.


