


Insights & Observations
Economic, Public Policy, and Fed Developments
- A common theme in recent client conversations is that the economic risks we currently see in the markets aren’t simply the size of announced tariffs or widespread federal layoffs per se. Rather, it’s the amount of uncertainty both have created and the impact it’s having on consumer and business behavior. The news cycle has been moving far faster than economic releases, but we are seeing the effects of these announcements.
- A change in purchasing habits emerged in consumer spending data released in March for the month of February. Retail sales missed at the headline, as gas and auto sales detracted, but “control group” sales and core retail spending beat handily, although likely due to tariff frontrunning. The implication, especially with weakness in food services, clothing, furniture, and sporting goods, is a pullback in discretionary spending and a sharper decline in staples.
- Later in the month, the personal consumption reports showed a surprise upside in personal income that didn’t flow through into spending. Real spending was below expectations and barely positive, meaning income translated into a surge in the savings rate. The problem is that the accompanying PCE deflator did not reflect this weakness. While it only beat expectations modestly, essentially every category within core PCE (except for transportation, echoing anecdotal reports of weakening demand from Delta earlier in the month) showed a steady increase in prices, broadly in line with the headline increase. This pattern, following a similar one in retail sales, suggests that consumers are still able to spend (and absorb price increases) on staples but are choosing to defer big-ticket purchases and experiences. Over short periods of time, this isn’t a problem as spending will eventually catch up, but longer term, the risks of legitimate economic harm increase.
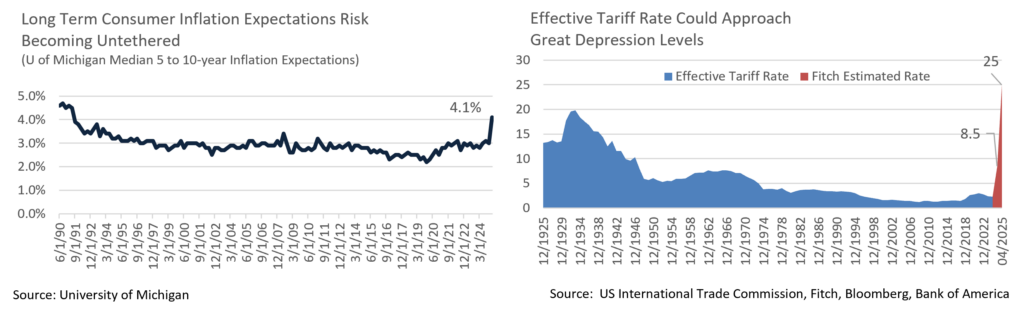
- Meanwhile, February’s tariff-driven growth scare may have been an underreaction. The tariffs outlined by Pres. Trump at the start of April were on the most aggressive end of expectations. Trump described his policy as “kind reciprocal” tariffs, a global 10% tariff, and for nations seen by the Administration as assessing the US at a higher average rate than that, roughly half of their average rate on their US imports, coupled with a 25% tariff on all imported autos. There is uncertainty around the rate calculations, which for certain countries is implausibly high. It appears to be based on the trade deficit as a percentage of exports rather than actual rates, a more aggressive model than even the “tariffs plus VAT” that was considered the worst case coming into the meeting. Tariff policy has been volatile for a long time, and we suspect the end game remains in flux. At a minimum, while there will be negotiation, there will also be significant trade retaliation, and inflation will likely rise while growth slows, particularly since the announced tariffs amount to 2.2% of GDP and 2x the largest tax increase in modern US history, according to Strategas.
- Even before the Rose Garden speech, tariff uncertainty weighed on the C-suite. So far, we mostly have anecdotal reports that businesses are pulling back on capex and hiring, and much of that – the March Beige book, for example, whose survey period ended before growth scares took hold in late February – is now badly out of date. But business sentiment has soured perceptibly and is likely to worsen in coming months.
- Inflation expectations bear watching here as well. In his FOMC press conference, Chairman Powell noted that the University of Michigan’s 5 to 10-year inflation expectations indicator hitting a 34-year high this month at 4.1% was an outlier but also added that other metrics were moving in the same direction and there was widespread consumer fear that tariffs were going to reignite inflation. Concern about future price increases on staples may also be depressing spending.
- Meanwhile, the Atlanta Fed’s GDPNow Q2 estimate has fallen to -3.7%. We don’t expect the actual figure to be this bad, and excluding gold imports (which have surged as the trade war intensifies) it’s only -1.4%, but this is another example of how overwhelming uncertainty is crippling growth.
From the Trading Desk
Municipal Markets
- Municipal yields rose over the month in a bear steepener. The 1 to 3-year part of the curve saw yields rise by 7-14bps, while the long end of the curve rose by over 30bps. The 10 to 15-year segment of the curve saw the steepest increase in yields at 40-42bps. Curve steepening was most pronounced out to 10-years, as the 2-10’s slope widened by 26bps ending the month at 58bps. After experiencing an inverted curve for quite some time, we welcome the value that a steeper curve delivers.
- In an environment of sustained UST volatility, municipal yields underperformed in March, and ratios widened by 5 to 10bps across the curve. The 10-year AAA Muni-UST ratio closed the quarter at 78%, a significantly higher level than the constrained ratios experienced over the past few years. For investors looking to add to their municipal allocation, higher relative value vs. USTs may provide a good entry point.
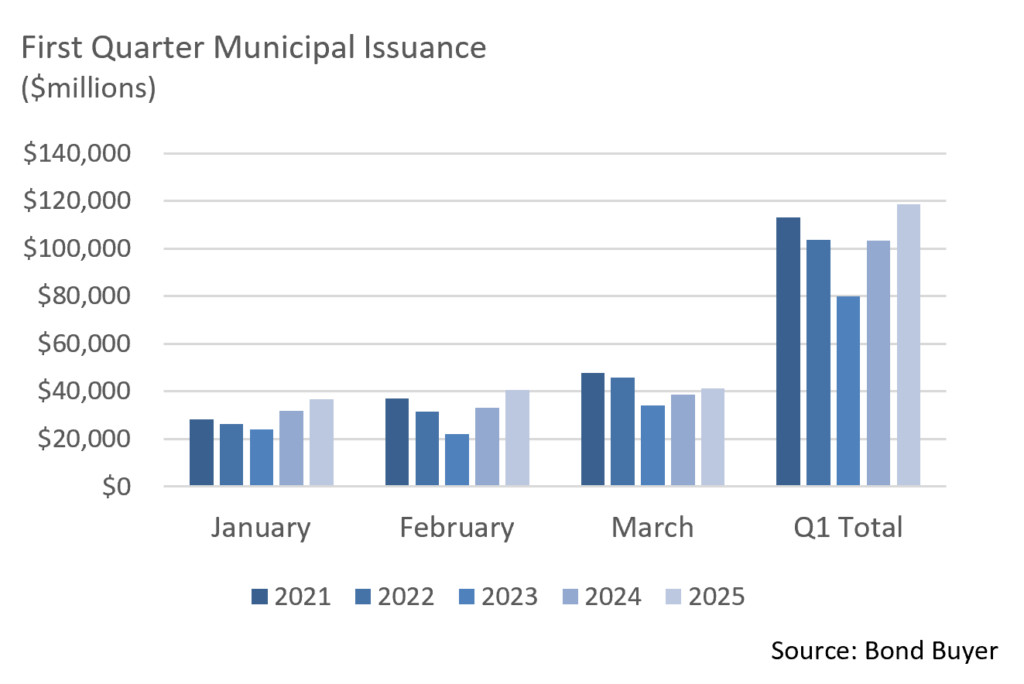
- March saw a robust new issue calendar, as issuance reported by Bloomberg totaled $41.385B, up about 7.4% over March 2024. This capped an already active start to the year as issuers sought to get ahead of policy unknowns, bringing YTD new supply to $118.7, up 14.7% over Q1 ‘24. Elevated new issuance often provides opportunities in the primary market in the form of wider spreads.
- March reinvestment of maturity and coupon payments totaled just shy of $31B, adding to technical seasonal weakness. Additionally, the secondary market has seen heavy bid-wanted levels as market participants contend with fund and tax-time outflows, a dynamic that has contributed to recent municipal underperformance.
Corporate Markets
- Investment Grade Corporate bond spread volatility was evident during March with tariff and recession fear headwinds accelerating. As the month began, spreads had already moved 10bps higher from the Bloomberg US Corporate Index YTD OAS low of 77bps reached in February. By mid-March, IG spreads had moved up another 10bps as risk tolerance abated. The market ultimately settled down, leaving spreads 7bps higher by month’s end at 94bps. These levels are still roughly 20bps off the 5-year average. It seems to us that the IG market is not fully pricing in growing recession risks and that spread volatility will likely remain entrenched as investors weigh the global tariff impact and economic dislocation.
- Uncertainty often creates urgency, and the High Yield market experienced that in earnest in March as issuers rushed to the new issue market, raising that month’s issuance to the highest level since 2021. New bond offerings of $27 billion in early March benefited issuers as risk sentiment had been moving in a positive direction. That changed quickly to the downside as tariff talks escalated and recessionary fears spiked. High Yield spreads reached an 8-month high of 347bps OAS on the Bloomberg US Corporate HY index, a 67bp monthly move. We see a good deal of room for High Yield spreads (a risk metric we closely monitor) to widen further. A “risk-off” environment will likely drive assets into higher quality and lower risk asset classes, such as USTs and high-grade municipals.
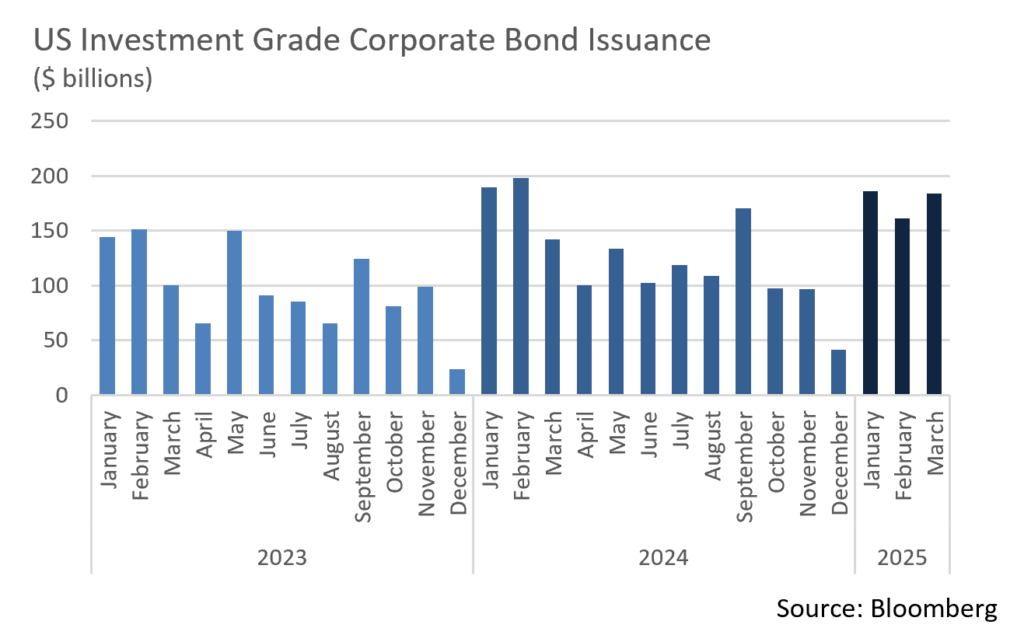
- Issuance in the Investment Grade Corporate markets has faced similar challenges of late, and issuers have been carefully picking their spots. Some have had to “stand down” and wait out the volatility as markets adjust to the latest news. This has created disorder on syndicate desks as issuance backdrops change nearly daily. The IG market ultimately produced $184 billion of new debt last month, the 4th largest March on record and $42 billion above the same period of 2024. It also contributed to the highest first quarter of issuance ever, with $531 billion coming to market. Expectations are for about $120 billion in April, although today’s high levels of uncertainty could slow the pace. Investor demand remains strong, and we are looking to add to portfolios as relative value materializes in increasingly fast-moving markets.
Public Sector Watch
Is the Municipal Tax Exemption At Risk?
Tax exemption headlines reemerged in recent weeks after Stephen Moore, an informal economic advisor to the Trump Administration, made comments regarding the topic. He floated altering the provision to help fund an expected extension of 2017’s tax reform in this year’s budget reconciliation bill. In his initial post, Moore advocated for “closing the State and Local bond loophole,” but then in an interview, he acknowledged that any change would likely require a cap on new municipal bonds rather than altering outstanding debt given political realities and pushback from state and local officials.
His remarks reinforced that the municipal exemption remains on the table as tax policy discussions continue. This is not the first time the exemption has been challenged, nor is it likely to be the last. A potential exemption cap is not a “new” idea, as it was floated by the Obama Administration more than once during his two terms.
A change to the exemption is a tax on all. Ultimately, any change in the exemption (either on the investor or issuer side) would result in higher costs for municipal issuers. The Moore example of a cap on the exemption for investors would impact demand, resulting in higher borrowing costs, which are likely to lead to increased local taxes. Although the impact would vary by issuer, the Public Finance Network estimates that eliminating the exemption would nearly double overall borrowing costs for municipalities over the next 10 years from $1.1 trillion to $1.92 trillion.
State & local governments shoulder the burden of infrastructure financing. The tax-exemption is a critical tool that has long enjoyed bi-partisan political support, as it facilitates state and local governments’ ability to finance high-grade US infrastructure. According to a recently released Congressional Budget Office report, state and local governments have financed 75% of all transportation and water infrastructure since 1990. Over the last 10 years, municipalities have issued $2.16 trillion of new tax-exempt debt to fund these types of essential projects.
Revenue raised would be minimal in scope. It has been estimated that eliminating the exemption would generate roughly $25 billion of additional revenue annually for the US Treasury, a modest amount relative to the estimated $4.6 trillion cost of making the 2017 tax cuts permanent.
How might the municipal market look in the future? We believe that any change to the municipal tax exemption would be for future issuance, not existing debt, as constitutional, legal, and practical factors associated with altering bond contracts create onerous hurdles. In the event existing bonds were grandfathered in and the exemption was only altered for future municipal issuance, outstanding tax-exempt municipal bonds would likely appreciate, given their scarcity value.
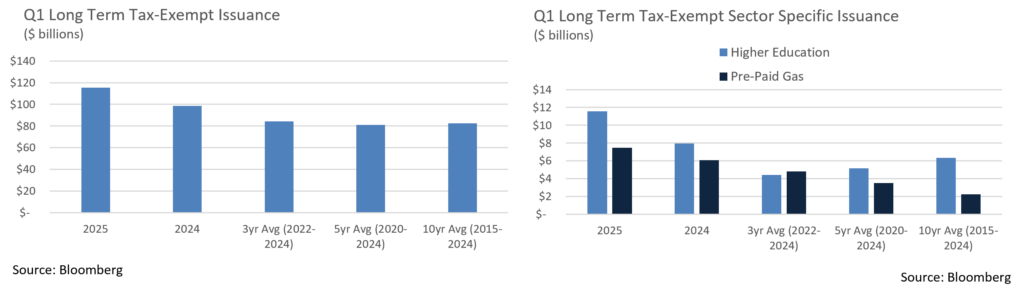
Market impact is already evident. Many market issuers have pulled deals forward to Q1 2025 due to these uncertainties. This dynamic has been most acute in sectors such as higher education and pre-paid gas (corporate-backed), as they are facing more intense scrutiny from the Trump Administration. Spreads have notably widened in higher education due to headline risk and increased issuance, and we are finding considerable value in select high-grade names that have historically traded at tight levels but are now offering incremental yield. While the eventual outcome of these negotiations remains uncertain, a strong lobbying push by advocacy groups with a vested interest in maintaining the status quo is underway, and we believe the importance of the municipal market is understood by most on Capitol Hill. While some parts of the market could lose eligibility (stadiums or corporations, for example), the ability of state and local governments to borrow at tax-affected lower rates is an essential economic tool that we expect to be maintained.
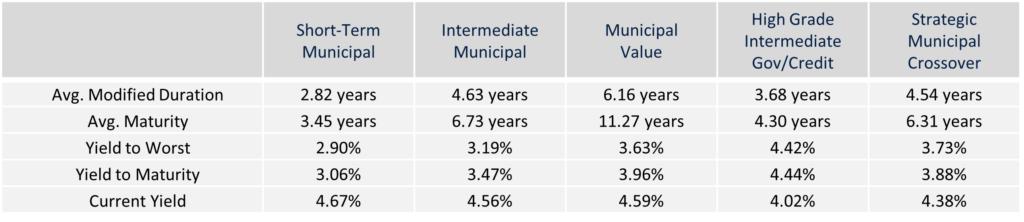
Composite Portfolio Positioning (As of 3/31/24)
Strategy Overview
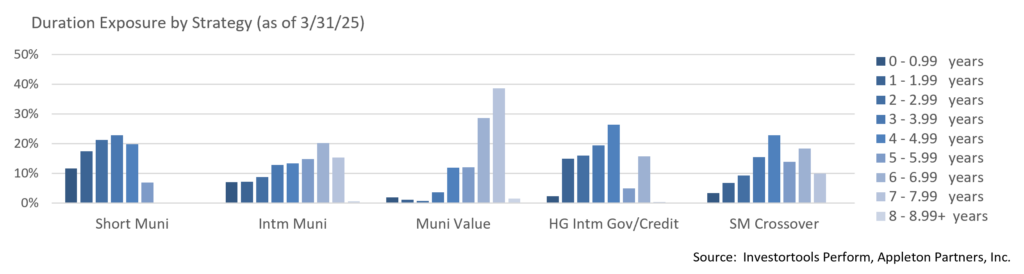
Duration Exposure (as of 3/31/24)
The composites used to calculate strategy characteristics (“Characteristic Composites”) are subsets of the account groups used to calculate strategy performance (“Performance Composites”). Characteristic Composites excludes any account in the Performance Composite where cash exceeds 10% of the portfolio. Therefore, Characteristic Composites can be a smaller subset of accounts than Performance Composites. Inclusion of the additional accounts in the Characteristic Composites would likely alter the characteristics displayed above by the excess cash. Please contact us if you would like to see characteristics of Appleton’s Performance Composites.
Yield is a moment-in-time statistical metric for fixed income securities that helps investors determine the value of a security, portfolio or composite. YTW and YTM assume that the investor holds the bond to its call date or maturity. YTW and YTM are two of many factors that ultimately determine the rate of return of a bond or portfolio. Other factors include re-investment rate, whether the bond is held to maturity and whether the entity actually makes the coupon payments. Current Yield strictly measures a bond or portfolio’s cash flows and has no bearing on performance. For calculation purposes, Appleton uses an assumed cash yield which is updated on the last day of each quarter to match that of the Schwab Municipal Money Fund.
This commentary reflects the opinions of Appleton Partners based on information that we believe to be reliable. It is intended for informational purposes only, and not to suggest any specific performance or results, nor should it be considered investment, financial, tax or other professional advice. It is not an offer or solicitation. Views regarding the economy, securities markets or other specialized areas, like all predictors of future events, cannot be guaranteed to be accurate and may result in economic loss to the investor. While the Adviser believes the outside data sources cited to be credible, it has not independently verified the correctness of any of their inputs or calculations and, therefore, does not warranty the accuracy of any third-party sources or information. Any securities identified were selected for illustrative purposes only, as a vehicle for demonstrating investment analysis and decision making. Investment process, strategies, philosophies, allocations, performance composition, target characteristics and other parameters are current as of the date indicated and are subject to change without prior notice. Not all products listed are available on every platform and certain strategies may not be available to all investors. Financial professionals should contact their home offices. Registration with the SEC should not be construed as an endorsement or an indicator of investment skill acumen or experience. Investments and insurance products are not FDIC or any other government agency insured, are not bank guaranteed, and may lose value.