Insights and Observations
Economic, Public Policy, and Fed Developments
- The end of the longest bull market of the modern era came suddenly, with investors experiencing the fastest 30% drop on record as much of the world’s economy ground to a near halt once Coronavirus mitigation efforts accelerated.
- The Fed responded with unprecedented policy action. While their initial “everything but the kitchen sink” surprise weekend package – cutting the Fed Funds Rate to 0-0.25%, announcing $700B in QE, and cutting reserve requirements while offering essentially unlimited repo capacities – left participants worried that the Fed had fully exhausted their stimulus capacity, those fears proved unfounded. The “plenty of space” Chairman Powell saw for future response ultimately included reopening a CP purchase authority to calm short term markets, unlimited QE, direct purchases of shorter maturity IG municipal and corporate debt, and $300B in small business lending.
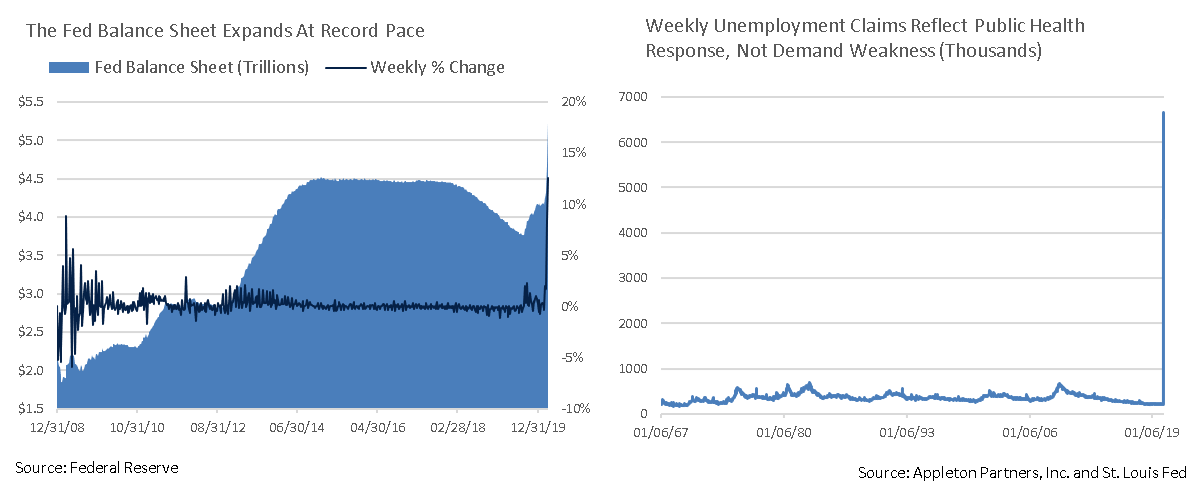
- The breakneck speed of this market correction may be unprecedented, but the Fed’s response is as well, and their stepping in as the “buyer and lender of last resort” has helped restore order to capital markets and a degree of investor confidence. The Fed’s balance sheet has already exceeded previous records, and Bloomberg estimates it could reach $12T in coming months. Global central banks have followed suit.
- The speed with which containment measures have been implemented has heavily damaged the US workforce – jobless claims surged to 6.6M over the week ended 4/3 on top of 3.3M the prior week. Job losses during recessions usually occur over years, whereas today’s highly compressed layoffs reflect a shutdown of non-essential businesses, not slackening demand. While we will very likely exceed the levels of the Recession of 2008, the frightening current pace of job losses doesn’t necessarily tell the full story.
- One encouraging note is that US manufacturing demand has been stronger than forecast. Chicago’s Manufacturing PMI was reasonably good, all things considered, at 47.8, and a plurality of respondents expected new orders to be largely unchanged in 3 months’ time. More than a quarter expected orders to be higher. Service PMI indices have been badly bruised, but manufacturing appears to be holding up better.
- The relationship between Russia and OPEC, specifically Saudi Arabia, has been a geopolitical variable that has contributed to market turbulence and remains uncertain. Conflict began as OPEC was preparing for a cut in production in response to sustained demand weakness. Russia promptly increased production. Saudi Arabia, who had already been impacted by oil production cuts in January, followed with significant price discounts for the US, Europe, and China. The price of WTI Crude Futures began the month at $47.33 but subsequently collapsed below $20 a barrel before recovering to $20.31 to close the month. This has put significant pressure on the entire energy sector, particularly HY debt, where spreads have been highly unstable.
- Our base case is now that Q1 GDP growth will be essentially flat and that Q2 will show a very large and likely record-breaking contraction. How quickly and forcefully economic strength returns is highly dependent on how quickly and to what extent Coronavirus mitigation efforts can be lifted. In the meantime, massive stimulus efforts and Fed support are helping to bridge the gap.


Equity News and Notes
A Look at the Markets
- March was the most volatile month in S&P 500 history with an average daily move of 4.9%. Since 1928 the Index has only posted an average of three 4%+ moves annually. The market’s peak to trough decline has been roughly in line with typical bear markets; it is the speed of the fall that is unprecedented, as the S&P 500 declined 30% in only 22 trading days. Since that time, volatility has remained the norm with equities at one point posting the second best 5-day move (+17.5%) in history. Jolting moves of this nature often happen as markets look for direction.
- The Energy sector has been hardest hit, as the price of oil dropped below $20/barrel. Financials have also been battered largely on liquidity fears and a precipitous drop in interest rates, which typically hurts profit margins. Other cyclical sectors (Industrials and Materials) have also underperformed. Technology, Healthcare, Consumer Staples, and Communication Services have outperformed and we expect leadership to remain in these areas.
- Sector performance has exacerbated an already large divide between Growth and Value styles. As of 3/31, the S&P 500’s LCG component was outperforming LCV by over 12% YTD. We continue to favor large cap names over small caps, largely due to balance sheet strength and ability to weather economic turmoil.
- Some welcome “green shoots” have become visible. CBOE’s Volatility Index (VIX), often referred to as Wall St’s “fear gauge”, has declined from an all-time high of 83 to 44.2 as of 4/6. While still elevated, declines even on negative days are positive. Although far from signaling an “all-clear”, the market surged to open the week of 4/6, breadth has firmed up, correlation among stocks shows signs of abating, and fixed income credit spreads are narrowing off recent highs. We are also encouraged to see insiders stepping in to buy their own shares. The ratio of insider buyers to sellers typically hovers around 0.5, yet that ratio recently increased to 1.75, the highest level since 2009.
- Rebalancing over the remainder of the year should create significant demand for equities as institutional investors and balanced funds need to add stock exposure to regain targeted allocation levels. However, heightened Federal scrutiny of stock buybacks is likely to hinder some of this net demand. In aggregate, JP Morgan sees +$3.71T in net equity demand through year-end vs. Q1 net outflows of $2.85T.
- Today’s environment offers little clarity on traditional fundamental measures such as revenue growth, earnings forecasts or valuation metrics. The paramount issue is stopping the spread of Coronavirus. With that in mind, we are closely following healthcare news from a humanitarian perspective and in terms of what it can tell us about the economic and market effect of this crisis. Market volatility will likely continue until we get a sense that those numbers are improving, at which point we could see a sharp upswing. Trading on 4/6 offered promise in that regard.
- To frame the recovery, consider that at quarter-end the S&P 500 was down 24% from its mid-February all-time high. An annualized return of 16% would allow investors to regain February’s high within 2 years. Past history suggests that it typically takes 2 to 3 years to recoup peak bear market losses provided one stays invested.
- Although considerable uncertainties remain relative to the trajectory of the economy, most analysts expect the recovery to be far quicker than past recessions, as this bear market sell-off has been event-driven, not cyclical or structural.
- The equity market’s best days tend to cluster near the worst ones, so absent a crystal ball, it is impossible to get one without the other. Missing the best 21 days over the past 21 years would produce a 0% total return over that period rather than a cumulative gain of 252%. While there is no way to say how long this period lasts with any certainty, bear markets ultimately end. Provided your asset allocation strategy, risk tolerance and personal circumstances have not fundamentally changed, staying invested during times like these will likely prove rewarding over the long run.

From the Trading Desk
Municipal Markets
- As we wrote in a recent market brief, Federal Reserve stabilization efforts have been swift and sizeable, with $450B already authorized in purchases of short-term municipals and IG corporates. The Fed is also proactively seeking to stabilize the short-term funding markets, including support for VRDNs.
- Amid sustained economic uncertainty, municipals continue to lag Treasuries. The 10Yr AAA Muni/UST ratio ended April 6 trading at an elevated 200% level. The short-end is even more distorted with the 2Yr ratio at 377%, creating favorable opportunities to swap out UST for high-quality municipals.
- Steepness is returning to the municipal curve, with the spread between 2 and 10Yr AAA issues back up to 38 bps, a development we feel is adding incremental value along the yield curve.
- Tax-exempt issuance is currently limited, with many borrowers waiting to see how market conditions develop before coming to market. Many issuers on the sidelines will likely bring bond deals should recent market stability prove to be sustained.
- After 61 consecutive weeks of inflows, we have now experienced 4 weeks of net mutual fund outflows. The most recent week’s $4.9B net outflow brings the YTD total to -$5.8 billion. This has produced forced selling into already strained markets, creating what we see as buying opportunities in certain names.

Corporate Bond Markets
- Although massive Fed stabilization efforts have helped investor confidence begin to re-emerge, we remain vigilant and only invest in what we feel are high quality, IG corporate issuers. Our credit research team is carefully reviewing each name we own and believes they are well positioned to manage through this very difficult economic period.
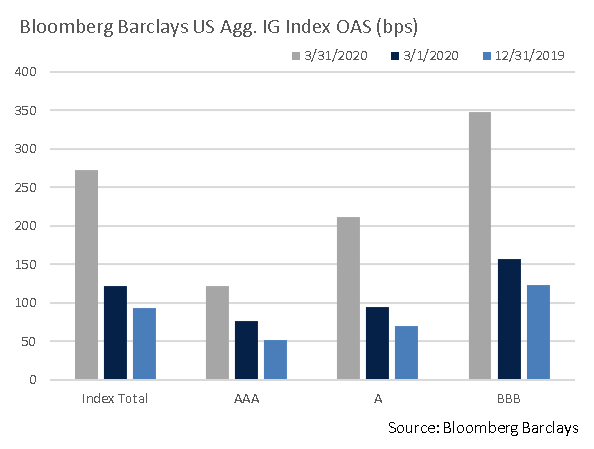
- IG risk appetite improved at the end of an extraordinarily volatile month, with spreads narrowing by 23 bps over the week ended 4/3. Dealers became net buyers and overall trading liquidity firmed. After hitting a high of 373 on 3/23, IG corporate spreads ended March at 272.
- The high-grade corporate market has recently seen an unprecedented surge in primary market debt sales as companies look to fortify balance sheet liquidity. March’s $259.2B of total new issuance was 46% greater than the previous record of $177.7B priced in May 2016. The $117B issued over the last week of the month was the highest on record despite above average concessions.
- Nonetheless, credit agencies are re-evaluating corporate ratings and, according to BofA Global Research, there were $560B of net downgrades in March. Certain names held in our portfolios will inevitably be impacted and we are assessing quality and relative value on a case-by-case basis.
- Retail flows remain sluggish, with Lipper reporting net outflows of $8.47B in IG mutual funds over the weekly period ended 4/1, although HY funds saw positive flows. Continued stabilization of the HY market, led by energy, would be a positive sign for the broader credit markets.

Financial Planning Perspectives
Washington DC Steps Up: The CARES Act
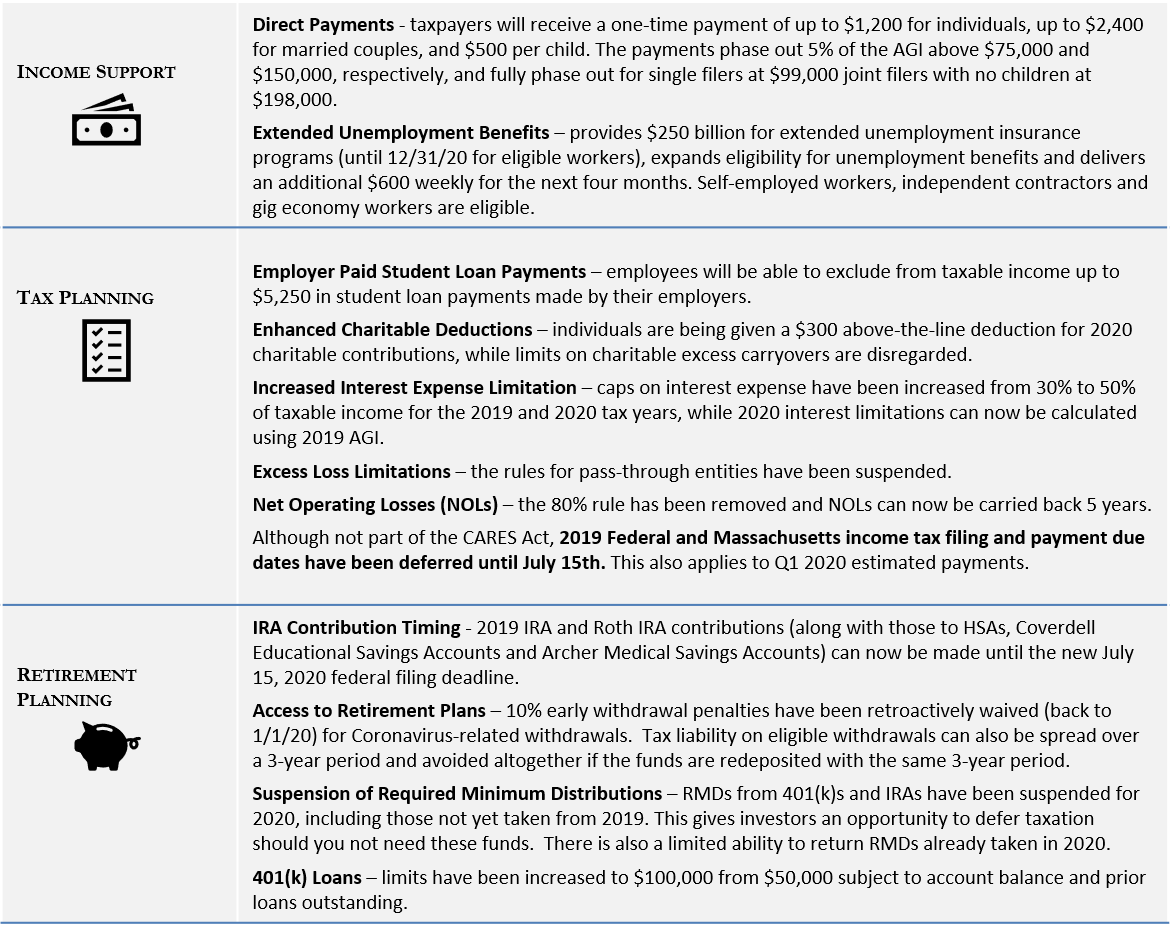
The CARES Act (Coronavirus Aid, Relief and Economic Stimulus) signed into law on March 27, 2020 represents a 3rd round of direct Federal assistance in the face of severe economic dislocation. The Act focuses on providing monetary and other financial relief to individuals and businesses and follows up on $8.3 billion of emergency medically related funding, as well as paid sick leave for individuals. Several provisions warrant attention given their potential impact on individual and family financial plans.
What You Need To Know About The CARES Act

Our Recommendations
These and a flurry of other new Federal regulations risk creating confusion. Appleton is here to help, and we invite you to reach out to your portfolio manager to discuss how we can help you benefit.
For questions concerning our financial planning or wealth management services, please contact
Jim O’Neil, Managing Director, 617-338-0700 x775, [email protected]


