


Insights and Observations
Economic, Public Policy, and Fed Developments
- For several months we have written about the tension between high inflation and robust consumer demand seemingly undeterred by higher prices. Inflation setting a new cyclical high in May, after what was widely believed to be an April peak, seemed to suggest demand was winning. However, several data points released in late June imply consumers may have reached their limit, and demand has begun to falter.
- First, retail sales came in unexpectedly weak in May, showing a modest nominal contraction even after prior period downward revisions. This series has been extremely volatile in recent quarters, so interpreting any one month can be problematic although there is growing anecdotal evidence of consumer weakness. Target cut its earnings outlooks in June and began running discounts on home goods and electronics, citing inventory mismatches as consumers moved away from home goods that had been popular during the pandemic. Both Walmart and Macy’s began running sales on casual apparel, as well, with Macy’s describing a reversal of the “nesting” phase of the pandemic.
- Even with such evidence of weaker demand, the final Q1 GDP release managed to surprise the markets. The headline revision was modest, -1.5% to -1.6%, but this masked a sharp drop in personal consumption from +3.1% to +1.8%. This decline was offset by a larger-than-estimated increase in inventories, revised up from detraction of -1.09% to -0.35%, likely due to the factors Target, Macy’s, and Walmart described. Higher inventories than originally measured in Q1 are also likely to weigh on Q2 GDP, in much the same manner Q4 inventories helped explain Q1 weakness.
- The consumer spending report released right after final Q1 GDP was if anything even more bleak; nominal spending missed, and every month of 2022 was revised lower. In inflation adjusted terms, consumer spending fell in May for the first time this year, -0.4% vs. expectations of -0.3%, and April was revised downwards as well. Real disposable income also fell, and with prior period revisions has now declined three of the last five months.
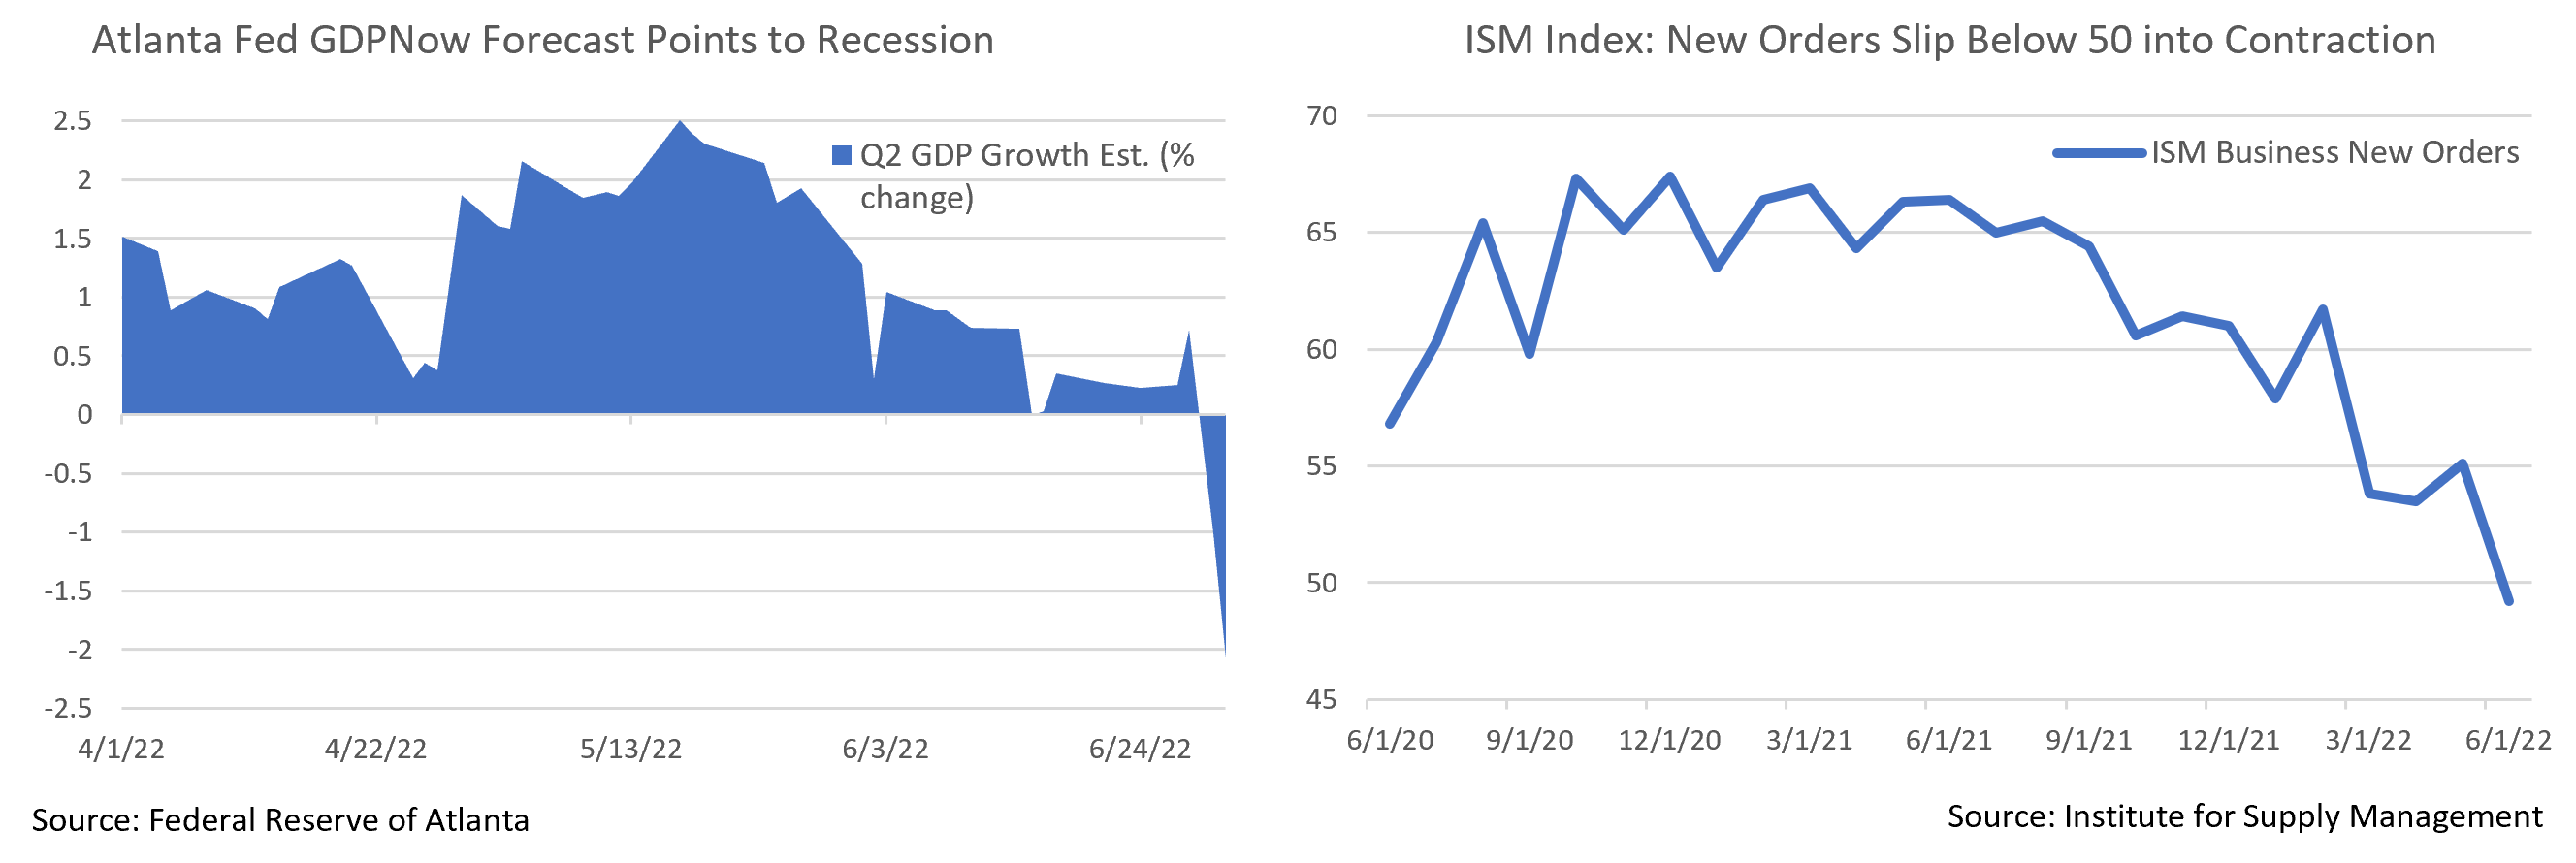
- Finally, the ISM Manufacturing report on July 1st gave markets further cause for concern; production, backlogs, prices paid, and supplier delivery times all improved, but new orders slipped into contraction territory. Production outstripping demand is an ingredient for falling inflation, but this is another indicator that consumer demand is flagging.
- The combined picture suggests a deceleration in personal spending that we have been expecting for some time, but from a lower base than previous releases had established. The Atlanta Fed’s GDPNow indicator, which had been fairly accurate over the past few years, saw its Q2 GDP estimation fall from +0.3% on June 29th to -2.1% on July 1st in response to these releases. There are a few weeks yet before the official release, but with live indicators now pointing to a Q2 contraction, it is increasingly likely that the US economy is technically already in a recession.
- The market abruptly repriced recession risk in response, with UST yields plummeting across all tenors. Fed Funds futures suggest the market still expects a total of 175 basis points of additional hikes through year-end, but now imply the Fed Funds rate will peak in early 2023 and the Fed may begin cutting by mid-year. This is internally consistent with Fed communications and a growing market consensus that the Fed is prepared to risk a mild recession if that is what it takes to get inflation under control before later adding back liquidity.

Equity News and Notes
A Look at the Markets
- Stocks slumped in June as the S&P 500 dropped -8.3% to log its second worst month of the year and bring the YTD total return just below bear market level at -19.9%. The tech-heavy Nasdaq fell -8.7% in June and is now down -29.2% YTD. The Energy sector fell -16.8% amid oil’s first monthly decline (-8%) since November. Defensive sectors outperformed with Utilities, Consumer Staples, and Health Care declining in the low-to-mid single digit range. Value has substantially outperformed Growth although both have produced negative YTD total returns at -12.9% and -28.1% respectively.
- The path of least resistance has clearly been to the downside as inflation, Fed policy, and recession worries remained at the core of the narrative. The first half of June saw a hotter-than-expected May CPI report which dented the “peak inflation” thesis and sent the S&P 500 to a YTD low. A bounce attempt later in the month drew support from a “bad news is good news” mentality as softer economic data tempered Fed hiking expectations. However, stocks succumbed to recessionary fears shortly thereafter as consumer confidence plummeted and inflation-adjusted consumption reported its worst month since Dec. 2021.
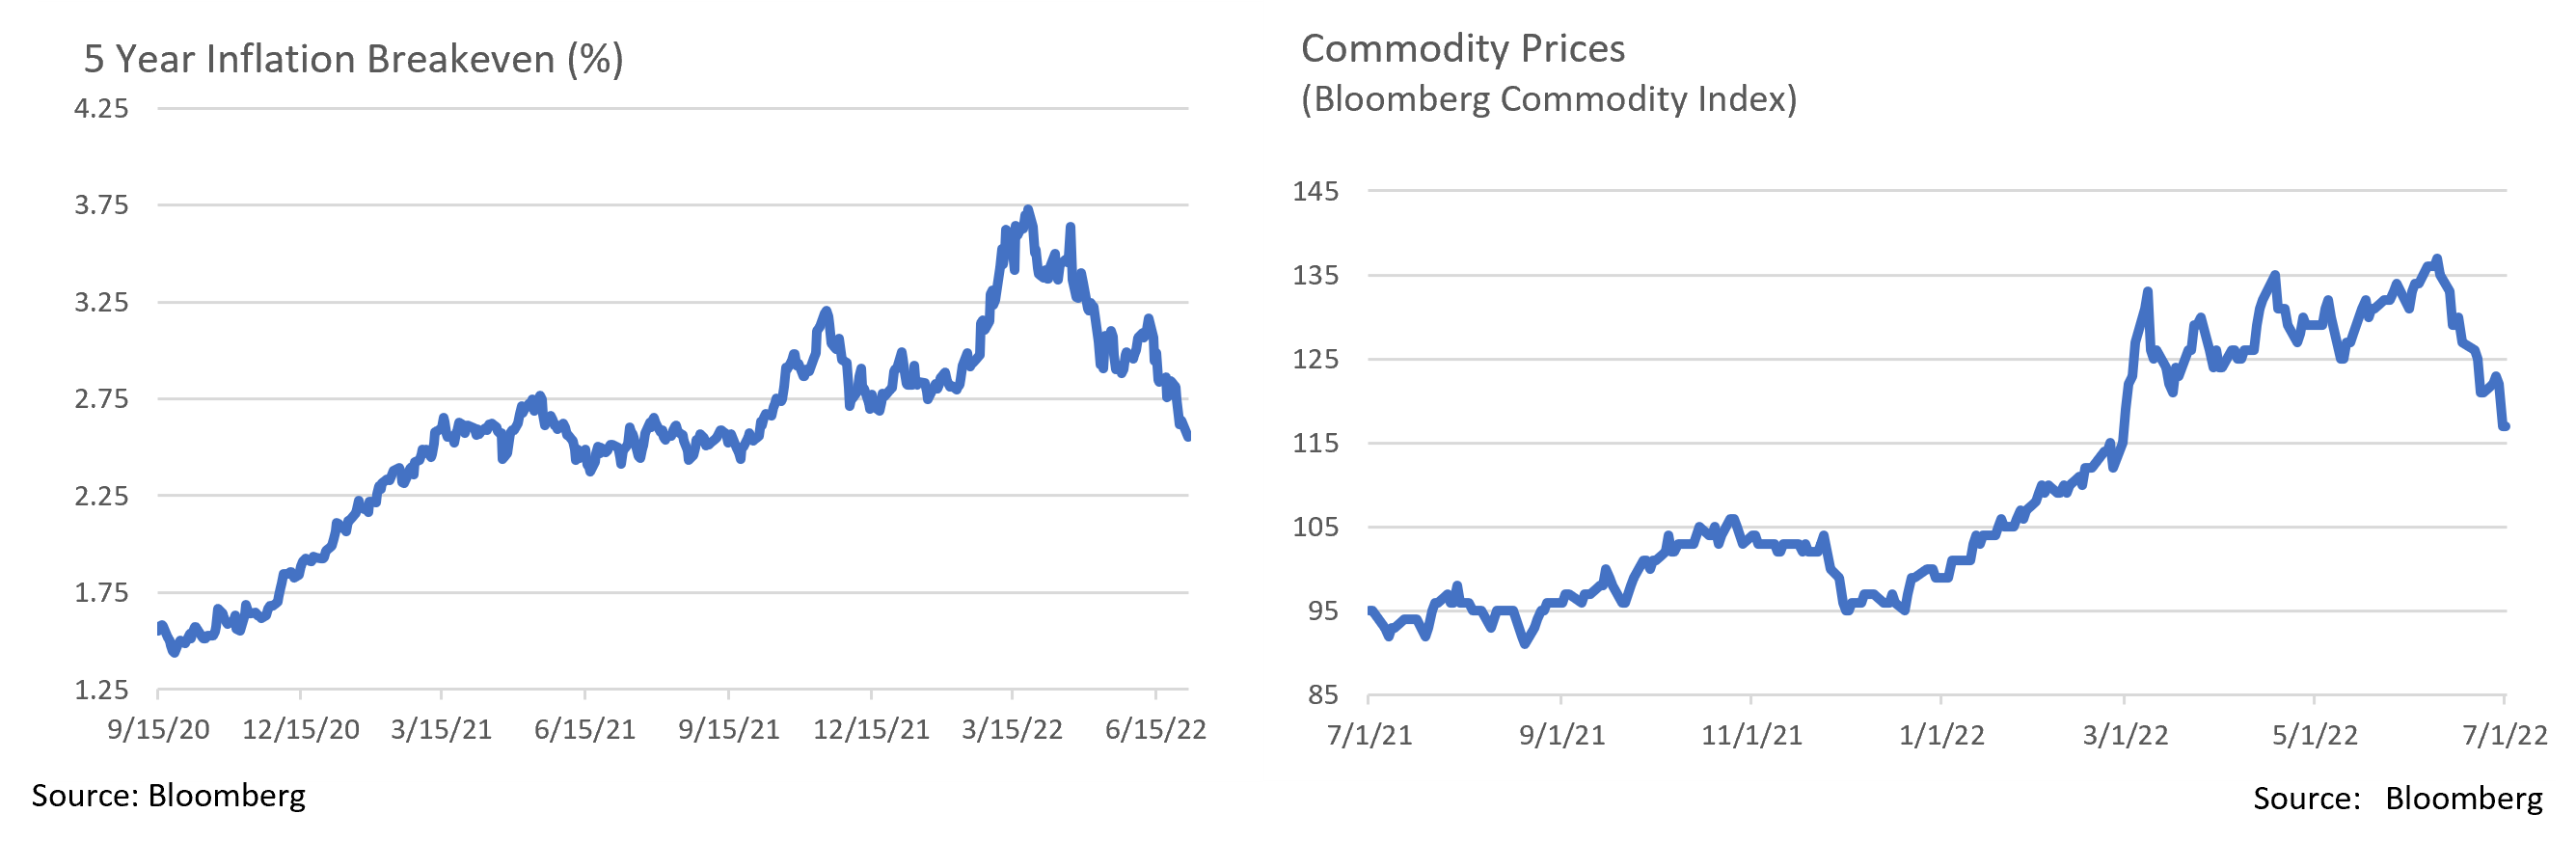
- While inflation remained a drag on investor sentiment, the financial markets are increasingly signaling that the spotlight has shifted to a recession watch. In the bond market, inflation expectations hit their lowest level in months. Investors sought protection as yields came off their highs across the curve with the 10Yr UST closing June at 2.98% after touching 3.50% earlier in the month. The UST curve flashed a recessionary signal by once again flattening, credit spreads widened from high yield to investment grade, and commodities also moved lower. Recent stock market leadership has come from defensive sectors such as Consumer Staples, Utilities, and Health Care that are often viewed as being “recession-proof”.
- The Fed is successfully slowing growth in an effort to tame inflation, but the price may be a mild recession. If economic data continues to weaken and inflation inflects lower, the Committee may be given wiggle room to pivot away from assertively tightening monetary policy. Less than a month ago, traders were pricing in a peak Fed Funds rate of more than 4%, well above the current range of 1.5%-1.75%, indicating the Fed needed to stay aggressive to not fall further behind the curve. Market expectations have since retreated to a Fed Funds peak closer to 3.3% by Q1 2023. A mild and short-lived recession could ultimately be what helps the stock market find its footing as it would likely remove considerable rate hike uncertainty.
- Away from monetary policy, investors will be keenly watching the upcoming earnings season. Input-price pressures, consumption trends, and FX headwinds all have factored into S&P 500 2023 earnings expectations moving lower after touching ~$252 a few weeks ago. This year’s drop in equity prices has been almost entirely due to valuation contraction, with the forward P/E multiple falling from over 21x to a current reading of 15.8x. Should analysts lower 2023 estimates further following what is likely to be a challenging reporting season, equity values could move lower. However, such a scenario could ultimately be conducive to a Fed pivot whereby monetary tightening slows, a dynamic that might prompt a higher equity multiple that could offset the drop in earnings.
- There’s no sugarcoating how rough 2022 has been, with the S&P 500’s 20% decline the worst first half since 1970. In searching for a silver lining, one could look to valuation as history has shown that lower P/E valuations typically lead to stronger five-year returns. Another could be that prior periods of comparable drawdowns have very often been followed by robust forward returns. Above all, long-term investors can take solace in the proven wealth generating capability of the equity markets.
From the Trading Desk
Municipal Markets
- Municipal yields ended higher in June along with USTs, with the 5 and 10-year AAA curve rising by 16 and 34 basis points, respectively. Price weakness occurred most notably in mid-June as the 10-year AAA peaked at 2.91%, a time period coinciding with the Fed Funds rate increasing by 75 basis points.
- Municipals look attractive relative to USTs, with the 10-year AAA Muni/UST ratio closing the month at 92% vs. a 10-year average ratio of about 88%. Recession fears continue to give the Treasury market a strong bid.
- The municipal curve has been flattening, as yields in the belly and long end of the curve were slightly lower at month end. Given this year’s overall increase in rates, we are capitalizing on opportunities to book losses, particularly on the longer end, and are redeploying assets emphasizing discipline in managing trading liquidity.
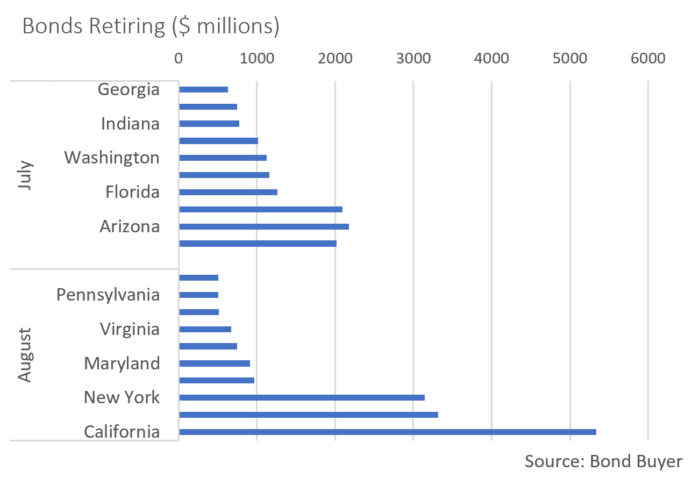
- Despite record YTD net fund outflows of ~$76 billion, we anticipate favorable municipal market technicals. June recorded significant net negative supply as $64 billion matured with only $17 billion issued in the primary market. June through August are historically the strongest months for reinvested cash and 2022 is likely to see $385 billion of principal and interest being returned to bondholders according to Wall Street estimates, an increase from $359 billion in 2021. Over the second half, about $233 billion of supply will be needed to offset debt service rolling off, a level we feel is unlikely to be reached, thereby fortifying net demand.
- Market liquidity remains tight as dealers are not holding high levels of inventory and supply is limited. Given the significant amount of cash that will need to be invested, bids should be strong. We anticipate sellers may be tempted to put more bonds out to bid as prices firm up over the summer months.
Corporate Bond Markets
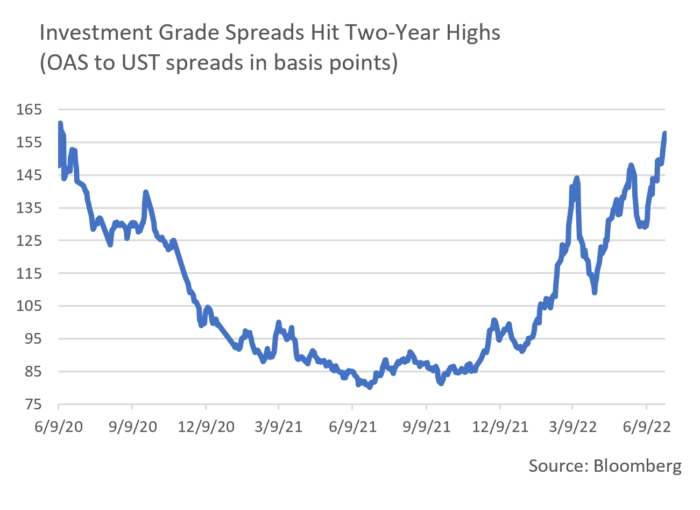
- Investment Grade credit spreads reached YTD highs in June as markets grappled with recession fears. This past month marked the third time this year there has been a four week stretch of spread widening. The OAS on the Bloomberg Barclays Corporate Bond Index closed at 155 basis points, a level not reached since June 2020. Additional spread widening is a risk given inflationary pressures and the possibility of recession, although we see favorable technical factors as a source of support.
- Market technicals remain a much bigger influence on spread direction than credit fundamentals. The new issuance market was slow in June, as only $69 billion came to market vs. expectations of $90 billion. Issuers are waiting in the wings as concessions remain elevated and risk-off sentiment has created an environment conducive to caution. It is rumored that several large deals remain “in the works” or “delayed” but nothing has come to fruition. On a YTD basis, IG supply is down 9% from 2021 ($716 billion vs. $787 billion). July is a very important month for earnings and a time in which blackouts take hold. Our view is that supply will most likely remain muted as issuers cautiously pick their points of entry.
- Weakness in retail fund flows has put further pressure on spreads with $22.74 billion of IG Corporate net outflows recorded in June and $68.3 billion YTD. Investor sentiment remains guarded.
- As part of a monetary tightening regimen, the Federal Reserve ceased reinvesting maturing USTs (up to a cap of $30 billion) and MBS (to $17.5 billion) each month. The pace in each asset class will double beginning in September, pulling demand out of the market. The Fed’s holdings of USTs fell below $3 trillion in June, the lowest level since November 2020. A partial offsetting factor lies in the Treasury slowing its borrowing needs.
- Overall, we see Fed policy normalization as necessary and appropriate, although it could put some pressure on USTs and MBS. Nonetheless, June was marked by a decline in UST yields, as the curve fell by about 12 basis points on weak disposable income and consumption data at month end.
Financial Planning Perspectives
Looking at Alternative Options Can Be Beneficial
Drivers of Private Market Growth
Historically, alternative investments such as private equity, venture capital, and direct real estate were primarily the domain of institutional investors such as endowments and foundations, pension plans, and sovereign wealth funds. Yet markets are ever evolving and a demand for greater diversification and alpha sources, more advanced technology, and a desire among alternative fund managers to broaden their client base has rapidly broadened access to alternatives.
Alternative investments are generally only available to qualified or accredited investors and access varies based on the nature of the private investment. That said, the alternative or private markets have grown considerably over the last decade and managed assets now exceed $7 trillion. The largest categories of alternative investments include private market equities, natural resources, real estate, infrastructure, and private debt. The past decade of growth in alternatives has been fueled by institutional demand with many buyers now allocating more than 20% to this space. High-net-worth (HNW) investors are also becoming an increasingly important constituency in alternatives. Oliver Wyman and Morgan Stanley conducted a survey last year that suggests HNW and ultra-HNW investors represent the market segments likely to make the largest increases in their alternative allocations from 2020-2025.
Alternative Investment Appeal
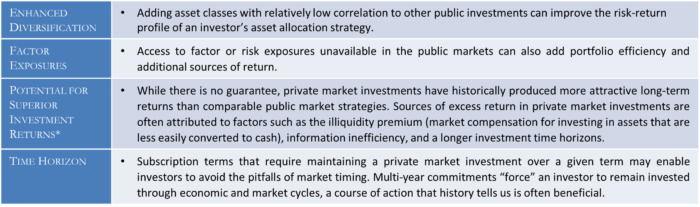
Why are HNW investors increasingly interested in alternative strategies?
Tradeoffs and Considerations
Of course, alternative investments are not for everyone. For one, an alternatives investor must be willing to assume significantly greater illiquidity, or inability to quickly and efficiently convert an investment to cash. Furthermore, an investor should not expect to receive distributions from a private equity allocation for at least 4 to 6 years after their initial commitment. Alternative funds also typically charge higher fees than mutual funds or separate accounts, most notably in the sharing of gains above a hurdle level with the investment advisor. As always, we recommend carefully reviewing fees and other terms. Private fund investments and other types of alternative investments are speculative and may involve a high degree of risk. There is no secondary market for the interests, and none is expected to develop. An investment should not be made unless the investor is prepared to lose all or a substantial portion of the investment.
Lastly, one should not pretend that alternative investments are immune to challenging economic or market conditions. However, in the case of private equity the early years of an economic downturn often create conditions conducive to favorable future returns. This is due largely to economic turbulence potentially revealing attractive long-term investment opportunities that a manager with capital locked into a fund for an extended period can pursue.
We believe certain clients may benefit from an allocation to alternative investments and have partnered with iCapital to offer that option. If you are interested in learning more about alternatives or our relationship with iCapital, please contact your Portfolio Manager.
For questions concerning our financial planning or wealth management services, please contact
Jim O’Neil, Managing Director, 617-338-0700 x775, [email protected]
*Source: Pitchbook Global Benchmarks as of 3Q 2021