


Insights and Observations
Economic, Public Policy, and Fed Developments
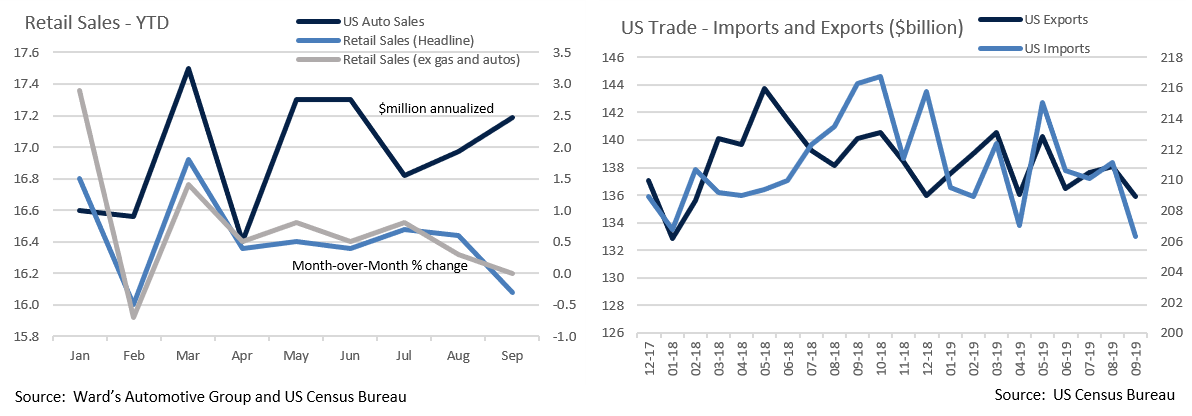
- October was dominated by the on again, off again announcement of a surprise “phase one” trade deal on the 11th. Markets initially rallied as President Trump touted an agreement halting the next round of tariffs in return for a $50B agricultural purchase commitment and intellectual property protections that appeared to include enforcement mechanisms. This proved premature, however, as the Chinese noted that further negotiations were needed and that the planned purchases were not feasible unless existing tariffs were also rolled back. While we welcome a halt to further escalation and renewed attention to IP protections, the move to a phased approach is itself a concession from the Administration’s prior all-or-nothing stance and suggests that many of the issues slated for later phases may be too thorny for negotiators. According to Bloomberg News, Chinese officials privately agree, noting that structural changes to the Chinese economy sought by US negotiators may not be solvable before the end of Trump’s first term and would require a full rollback of US tariffs, an unlikely concession. Against this backdrop and the weight of slowing global growth, exports and imports slumped to nearly two-year lows.
- The Federal Reserve had a busy month as well. Stressing that this was not a new round of quantitative easing, Chairman Powell introduced a new bond-buying “reserve management” program at the start of the month to ease turmoil in the repo markets. Then, as expected, the Fed lowered the Fed Funds Rate by a further 25 basis points. The accompanying statement replaced language saying they would “act as appropriate to sustain the expansion” with a more muted pledge to monitor the economic outlook. The implicit message was rates are likely on hold unless the economic outlook deteriorates further, although measured in conjunction with the reserve management program, the Fed remains reasonably dovish. The market implied probability of a December cut was little changed, falling from 26% to 22%.
- Economic indicators have generally been weak. US Retail sales for September missed badly, down 0.3% vs expectations of a 0.3% gain, although ex-gas and auto sales, the month was flat. While the decline in auto sales (-0.9%) came after a strong August (1.9%) and was negatively impacted by the GM strike, month-over-month volume notably increased, implying the drop was impacted by discounting and/or consumers choosing lower cost vehicles, potentially troubling trends in a consumer dependent economy.
- Elsewhere, the Fed Beige Book described growth as slowing to a “slight to moderate pace”, while consumer confidence softened off relatively high levels. Industrial production and durable goods orders missed, evidencing further contraction in the manufacturing side of the economy.
- The most encouraging news of the month came after it ended, when on 11/1 the jobs report came in at a considerably better than expected 128k – expectations were for 85k. While nominally the third weakest of the year, it was impacted by 41.6k in job losses largely due to the GM strike and 20k in temporary US Census contracts concluding. While hiring continues at a slower pace than 2018, the unexpected resiliency of the labor market is encouraging at a time when consumer spending is critical to sustaining the economic expansion. Equities rose on the news, and a modest miss on a still-contracting ISM Manufacturing number later that day did not dampen enthusiasm.
Equity News & Notes
A Look at the Markets
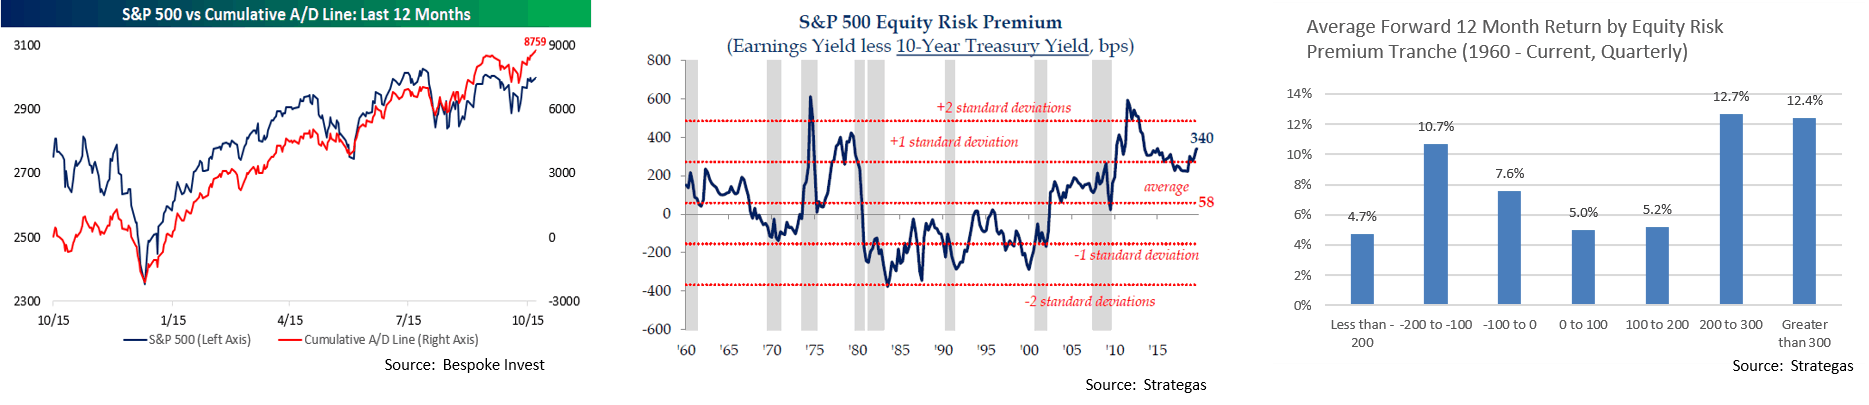
- The S&P 500 gained 2.2% in October raising YTD returns to a robust 23.2%. The index hit an all-time high towards the end of the month, driven by optimism around a possible phase-one trade deal with China, another interest rate cut and dovish Fed commentary, and a better-than-feared start to Q3 earnings season. We were pleased to see the market’s strength reinforced by other “risk-on” indicators, as Nasdaq, most notably the technology sector, small caps, foreign developed, and emerging markets all outpaced the broader index. Solid breadth indicates healthy market participation, and the cumulative advance/decline line has also reached all-time highs. Lastly, the recent rally has seasonality in its corner, as the November-January period has historically been a good one for stocks.
- Above all, equity returns are driven by earnings and we are now about 70% through the Q3 season. Despite mixed results, earnings have generally held up reasonably well despite a slowing economy. The blended quarterly earnings growth rate of -2.8% represents an improvement over a September 30 consensus -4.0% estimate. The earnings “beat rate” has been 75% with a surprise margin of +3.9%. While the percentage of companies beating expectations is in-line with recent averages, beat margins lag the past year’s quarterly average of +5.2%. Looking forward, we are focused on the extent to which 2020 earnings estimates rebound as this will influence the trajectory of equity performance. Estimates have recently declined modestly to +9.8% growth for the full year.
- With equities at all-time highs, a common question concerns stock valuations. The S&P 500 does look a bit expensive at a 17.3x forward P/E (vs. 5-year average of 16.7x). And it’s not just price to earnings. Stocks are also expensive on a P/B, P/CF, and CAPE P/E basis versus historical averages. However, we would argue that stocks deserve a modest premium during periods of low interest rates and inflation. To this point, stocks appear historically cheap relative to bonds when looking at a forward S&P 500 earnings yield of 5.8% (inverse of the P/E) compared to 2.30% and 1.83% on the 30Yr and 10Yr UST respectively. From an asset allocation perspective, the valuation on stocks is far from demanding. As seen in the chart below, over the past 60 years when stocks have been this cheap relative to bonds, the next 12-month return has been greater than 12%.
- The secular bull run of the past decade has consistently had its fair share of doubters and investors have recently grown even more skeptical. The latest Barron’s Big Money poll of money managers showed the lowest bull reading (27%) in over 20 years. And it’s not just professionals; consumers have also turned sour on the market. The latest consumer confidence survey revealed more bears than bulls (32.2% vs 31.7%), a puzzling sentiment given all-time high equity values. We view these doubts and fears as contrarian positives. Stocks tend to do better when there is a wall of worry to climb and worse when there are signs of irrational exuberance.
From the Trading Desk
Municipal Markets
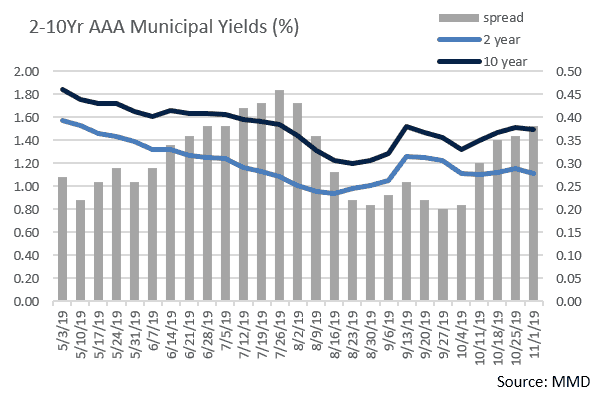
- The municipal curve steepened during October with the spread between AAA 2s and 10s increasing to 30 basis points, 10 basis points wider than the beginning of the month. This followed a similar steepening of the Treasury curve as the Fed cut short rates, while the longer end was influenced by modest improvement in trade and economic sentiment. A steeper municipal curve is welcome as it now offers a bit more value for adding duration. In aggregate, our heaviest exposure remains in the 6 to 10-year portion of the curve.
- We continue to see very strong demand for municipals from mutual fund investors with 43 consecutive weeks of positive net cashflow. $75.1 billion of net assets have flowed into municipal funds year-to-date, the highest level since data began being reported in 1992. A desire for tax-advantaged income and skepticism concerning equities amid an aging bull market have helped keep municipals in favor.
- Supply picked up considerably over the second half of the year after lagging through Q2. As of the end of October, year-to-date issuance reached $330.3 billion, nearly matching $338.9 billion for all of 2018. October 2019 issuance of $52.2 billion is 43% greater than the prior year’s monthly figure. This phenomenon has been heavily impacted by a surge in taxable municipal offerings, as today’s highly compressed yield environment has made taxable advance refundings of tax-exempt bonds economical.
- The usually staid world of Variable Rate Demand Notes (VRDNs) has recently experienced tremendous yield volatility.Yields began Q3 at the year’s low of 1.2%, although low rates are not unusual for early July due to large maturities and interest payments. Upon spiking to 1.6% in late September, VRDN yields temporarily equaled 15-year AAA municipals given what was then a very flat yield curve. As quickly as VRDN rates climbed late in Q3, they fell even faster in October, dropping an average of 10 basis points a week to finish the month at 1.12%. Despite sizeable October municipal issuance, much was taxable and mutual fund demand for VRDNs has been high as managers scramble to stay fully invested.
Taxable Markets
- As we moved into the final week of October, Investment Grade Corporate issuance was looking like it was going to fall far short of expectations. The $39.5 billion issued during the first three weeks of the month was less than half the market’s $85 billion expectation, a development that tightened already lean supply. Although a surge over the last week of October resulted in $28.8 billion coming to market, bringing the month’s total to $69 billion, this was still the quietest October since 2014. A lack of bank issuance and corporate earnings blackouts has constrained supply, providing further impetus for corporate credit spreads to remain in rally mode.
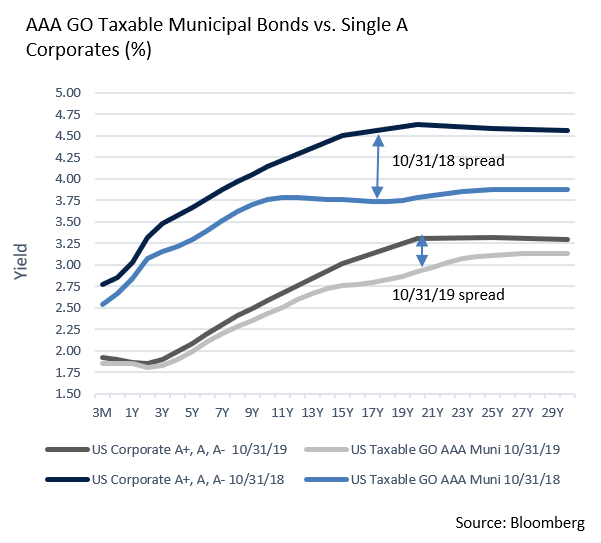
- Interestingly, we saw a substantial increase in Taxable Municipal issuance and yields on some deals have been close to the levels at which Single A corporate bonds are trading. The accompanying chart comparing Single A corporate bonds to AAA Taxable GO bonds reveals that the spread between the two asset classes has narrowed over the last year. This has prompted crossover buyers to consider Taxable Municipals as a viable complement to Corporates.
Financial Planning Perspectives
Don’t Let Tax Simplification Create Complacency
Last year’s tax preparation season was the first following passage of the 2017 Tax Cuts and Jobs Act. Last year we covered tax reform implications for individuals and highlighted the impact of doubling the standard deduction and imposition of a $10,000 state and local tax deduction (SALT) cap. As expected, the number of filers itemizing deductions in 2018 dropped significantly from roughly 45 million to 18 million.
While tax planning may have become simpler for most, there are still many important items to consider heading into year-end. Acting now can help reduce your near and longer-term tax burdens.
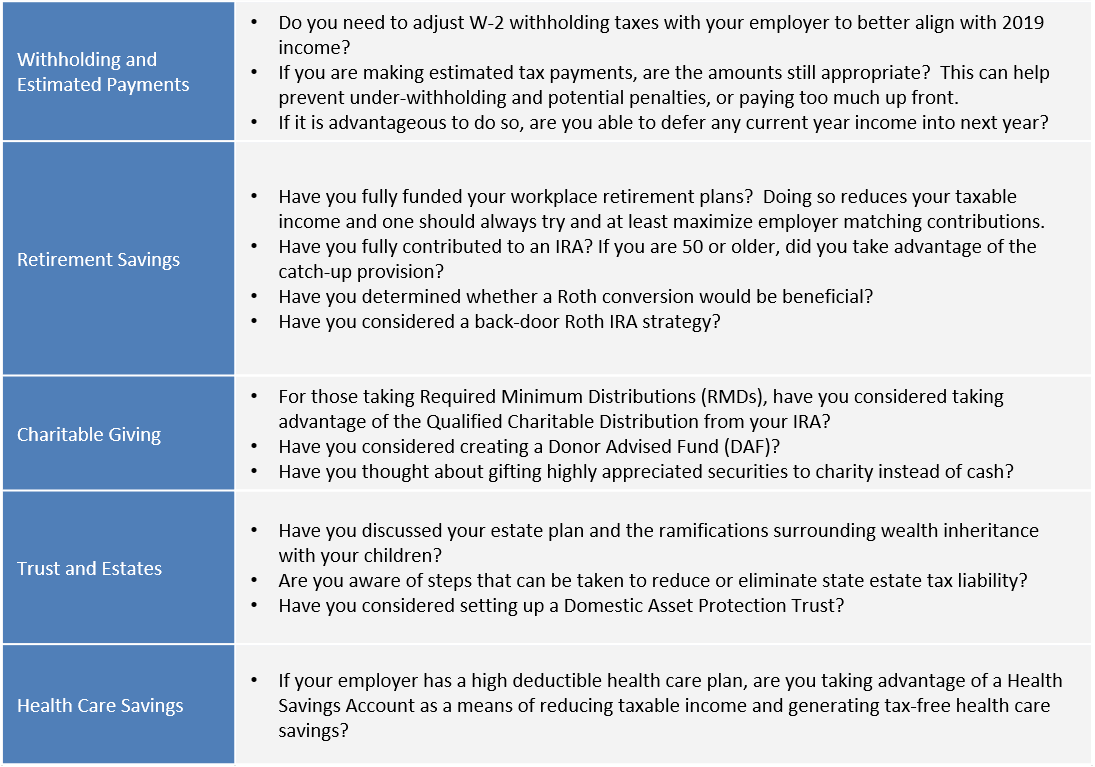
Proactive tax planning is essential to efficiently managing current obligations as well as the amount of your wealth that can be shielded from future estate taxes. Working closely with your tax advisor and portfolio manager can make a big difference. Reach out and let’s plan together.
For questions concerning our financial planning or wealth management services, please contact
Jim O’Neil, Managing Director, 617-338-0700 x775, [email protected]