


Insights & Observations
Economic, Public Policy, and Fed Developments
- September’s Fed decision was going to be a surprise no matter what, a rarity in the Powell era, with cut expectations closely balanced between the 25 and 50bps camps before the meeting. Powell ultimately went with 50, positioning this decision as a “catch-up” cut after better-than-expected June inflation data arrived after their July meeting. Indicating they likely would have cut then had they known what they know now, Powell pushed back against future 50bps cuts. He described risks to the Fed’s dual mandate as “relatively balanced,” and suggested the timing and size of future reductions would be data dependent.
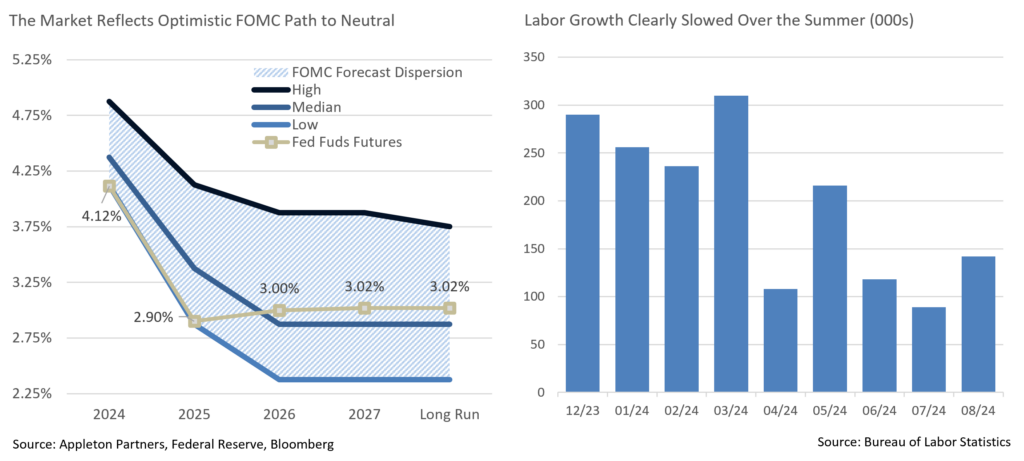
- Going into the meeting, we felt the size of the cut mattered less than the quarterly update to the Fed’s “dot plot,” which we expected to show less accommodation than the market foresaw. Sure enough, while the dots came down from June, they remain well above market consensus. The Fed funds futures market now matches the most optimistic of the dot plot projections for the next 12 months, suggesting future volatility as expectations unwind. Since the meeting, the market-implied long term neutral rate has begun to rise, which we feel is appropriate given the pronounced upward skew in the Fed’s estimations of neutral. Treasury yields have drifted up since the meeting to reflect this, a trend we expect to continue.
- With inflation benign, labor conditions are likely to drive future Fed policy changes. We’ve seen a deceleration in employment growth this year; August’s employment, at 142k new jobs, came in under expectations and brought with it moderate downward revisions to prior periods. September’s report, due on October 4th, is expected to only modestly rebound to 150k; an upside or downside surprise could set the tone for the rest of the year.
- A reason for cautious optimism came with the final revision to Q2 GDP. The headline report remained unchanged, at +3.0%. However, there was a substantial revision to GDI, Gross Domestic Income. GDP, by definition, equals GDI, so with GDI at +1.3% after the first revision, there was risk of a downward GDP revision. Instead, GDI was revised substantially up, to +3.4%. At least at the start of Q3 consumers had higher disposable income and savings than previously estimated. In theory, this should be supportive of labor demand and job creation.
- Another source of uncertainty will be the impact of Hurricane Helene, a “1,000-year storm” that ravaged North Carolina over the last several days. The human cost is incalculable; the impact on hiring in September will be modest given the timing of the storm, although it will undoubtedly depress October’s report.
- Inflation could still become a problem. Falling commodity prices have helped bring down headline inflation for much of the year, in part due to a sputtering Chinese economy. China unveiled a significant stimulus program on September 23rd, a multi-barreled approach to boosting growth that included lower rates and a loosening of housing market controls. The Chinese stock market roared in response. It’s unclear if even this package goes far enough to address China’s housing market problems, but if it translates into sustained demand, commodity prices could rise. This could boost US inflation at a time when core inflation is still running around 2.5%, above the Fed’s 2% target.
- Another possible source of price pressures could come if the International Longshoremen’s Association strike on the eastern seaboard that began on the first of the month stretches into weeks rather than days; roughly half of all US trade is estimated to pass through impacted ports.
Equity News and Notes
A Look At The Markets
- The major US averages closed higher to end Q3 as the S&P 500 gained +2.0%, breaking a streak of 4 straight losing Septembers. The month got off to a slow start with the S&P 500 posting its worst week (-4.3%) since March 2023, but rallied to finish higher for the 5th month in a row and 10th of the past 11. The Nasdaq (+2.7%) outpaced the S&P 500, whereas the DJIA (+1.9%) and small cap (+0.6%) underperformed. Sector performance was mixed with a combination of cyclicals and defensives such as Energy, Healthcare, Financials, and Staples lagging, while Consumer Discretionary led.
- Achieving all-time highs is nothing new for this market as the S&P 500 closed the month at a record level for the 43rd time this year. What was unique about the latest high-water mark is that it came without the Technology sector also making a new high. Technology, the largest S&P sector, has led the market since the beginning of 2023, but peaked on July 10th and closed Q3 -4.6% off its high. This dynamic suggests there may a hand-off in leadership at work along with healthier breadth we have been highlighting in recent commentary.
- With a +20.8% return, the S&P 500 is having its best year to this point since 1997. The Index tends to take a well-deserved breather after similarly strong stretches, dropping in 7 out of 9 prior occurrences. Despite October’s historic weakness, the market has often subsequently rallied to close higher over the full fourth quarter, a scenario we feel is reasonably likely this year with the election behind us by early November.
- Multiple factors contributed to September’s rally. The Fed launched an easing cycle with a surprise 50bps cut as they signaled greater concern over signs of slowing economic conditions than guarding against consistently receding inflation. The soft–landing narrative has remained intact as recent economic data supports the argument that the economy is holding up quite well. GDP and GDI were revised up and the US savings rate was revised up to 5.2% from 3.3%, helping to buoy the consumer along with a resilient labor market and lower energy prices.
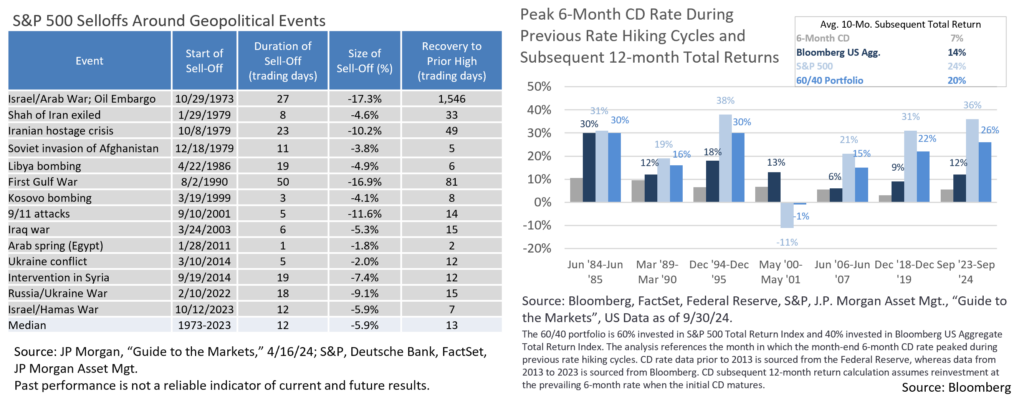
- With Middle East conflict worsening, we felt it was timely to recirculate the accompanying table. Geopolitical risks always exist, and they often cause short-term volatility as the market tries to discern the impact. Fortunately, few instances result in sustained impairment to US economic health and corporate profits. More often than not, staying invested as the turmoil plays out is the prudent move.
- Another big story came from Asia as a tidal wave of stimulus was unleashed by the Chinese government. Their actions, including cuts to rates, reserve ratios, and downpayment requirements; liquidity support for banks; and a direct injection into the stock market pumped up Chinese equities. The CSI 300 rallied +25% in the last 5 trading days of the month, including +8% on September 30th. The index went from a 52-week low to a 52-week high in less than 2 weeks, a historic move. Previous stimulus efforts proved to be short-lived, and Chinese markets are closed through October 8th for the National Day holiday, so we’ll have to wait to see if enthusiasm holds. Many US companies have exposure to Chinese markets, particularly in the Technology and Materials sectors. We will be looking for an indication of how significant an effect Chinese stimulus will prove to be.
- One of the more compelling charts we have recently come across is the one below highlighting returns in stocks, bonds, and the 60/40 portfolio following peak short-term rates in prior hiking cycles. With the Fed signaling a shift in monetary policy and CD rates already falling, history tells us that both stocks and bonds can perform well, and that there is likely to be a very real opportunity cost incurred by those seeking the safety of CDs and money market funds.
From the Trading Desk
Municipal Markets
- The AAA municipal yield curve moved lower over the course of September in what was close to a parallel shift of about 10bps. Over the quarter, yield curve decreases were more significant at the 5 and 10-year spots at 44bps and 22bps, respectively, a continuation of curve normalization.
- After an historically atypical period of inversion, the municipal curve has finally steepened and the spread between 2s and 10s is once again positive at 30bps after starting Q3 with a 27bps inversion. This un-inverting process is new to the municipal market and investors are now charged with anticipating how the curve will evolve. As discussed, in Intermediate strategies, we are finding value in the belly of the curve between 6 and 9-year maturities after previously seeking to barbell exposure on the short and longer ends when curve inversion was pronounced.
- The 10-year AAA Muni/US Treasury ratio was largely unchanged in September, remaining right around 69%. Despite sitting below long-term averages, this level offers significantly more value than earlier in the year when it was in the high 50% range.
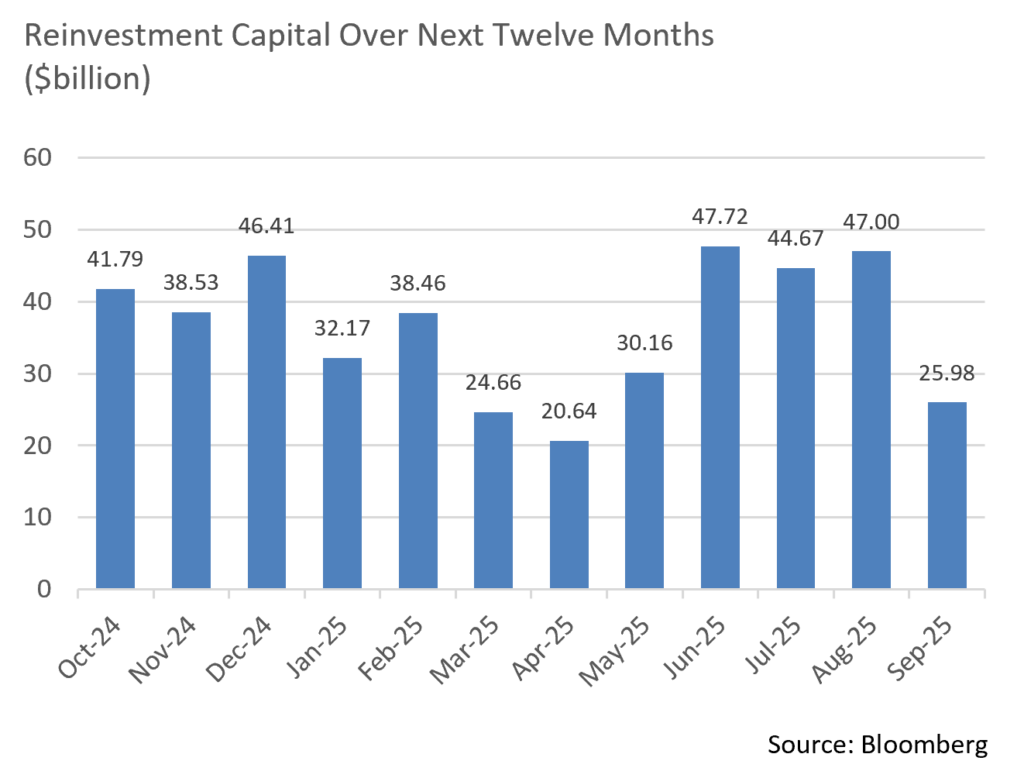
- Issuers are continuing to bring deals to market ahead of the election. According to Bloomberg, September saw a total of $49.16B in issuance, a 63% increase over the same time last year and the highest September total since 2020 during the pandemic. YTD, these elevated issuance levels are running about 35% ahead of last year’s comparison. While the summer months bring with them elevated reinvestment levels, September’s reinvestment capital was lower at $31B. Despite this technical support factor receding, September’s deals were well received by investors.
Corporate Markets
- September saw a flurry of new Investment Grade Corporate bond issuance as the Fed’s route to a lower Fed Funds rate became clearer after its October 50bps surprise. Fueling this new issue rush is the uncertainty of an impending Presidential election as well as a quiet earnings blackout initiated at the beginning of October. The $170.6 billion of new debt sold in September smashed previous highs ($164 billion during the pandemic in September 2020) to become the largest September on record, a surge in new supply that increased YTD issuance to $1.26 trillion.
- We expect new issuance to slow somewhat in Q4 as a degree of market volatility is anticipated. However, demand remains strong with new recent issue concessions mostly under 3bps, below historic norms. Another indication of robust credit appetite can be found in the high yield market, as 14 of 17 recent new offerings we tracked traded tighter in the secondary market a week out.
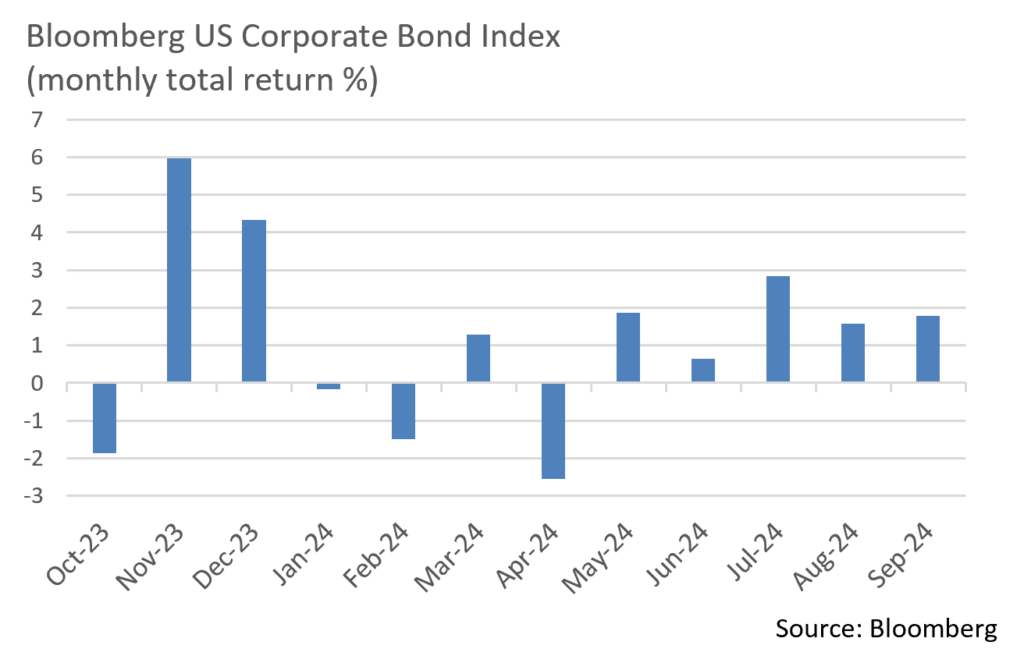
- Bolstered by strong demand, the Bloomberg US Investment Grade Credit Index recorded its 5th straight month of positive returns in September, raising it’s YTD total return to +5.32%. Longer maturities and lower quality issuers were the best performers, likely due to investors chasing yield ahead of the Fed’s easing. Although July was the best performing month of the year (+2.38%), this recent 5-month stretch marks the best sustained IG Credit performance in quite some time. Strong returns have largely been a function of downward pressure on UST yields, although excess returns over USTs have also added value.
- Amid the issuance flurry, the market has consistently demonstrated an ability to easily absorb new debt. An appetite for high quality bonds has kept spreads in check throughout the year. On an OAS basis, the Bloomberg US Corporate Bond Index began the month at 93bps and hit a high of 99bps mid-month only to rally on the Fed ease to close at 89bps. This is only 4bps off a May YTD low of 85bps and 10bps off where the year began. We continue to feel that spreads will remain range-bound through year-end.
Financial Planning Perspectives
A Look At The Private Side Of The Capital Markets
Private markets involve investing in companies or other assets that are not publicly traded on exchanges. Unlike buying stocks in well-known public companies, private market investments often involve entities such as start-ups, private equity firms, or real estate projects. Seeking higher returns with lower correlation to public stock indices, institutional investors such as endowments, foundations, and sovereign wealth funds have meaningfully increased their allocations to private markets, leading private market assets to triple over the last decade. Many high-net-worth investors who meet Federal qualification standards have also gravitated towards private markets for the same reasons.
A growing development in fundraising lies with tender or interval funds, and it is interesting for high-net-worth individuals because it addresses some of the challenges that non-institutional investors face when accessing the private markets, most notably:
- Significantly broader access: most vehicles are open to accredited investors and have minimum investments as low as $10,000 per fund.
- Improved liquidity terms: tender and interval structures are generally considered “semi-liquid”, offering partial liquidity on a recurring basis.
- Enhanced reporting: these funds typically provide more frequent reporting than most other private funds, including monthly net asset value updates. They are also regulated under the Investment Company Act of 1940 and are registered with the Securities and Exchange Commission (SEC).
- Simplified tax reporting: most funds are structured for 1099 tax reporting rather than a partnership K-1, the latter of which is more complicated and slows down the tax filing process.
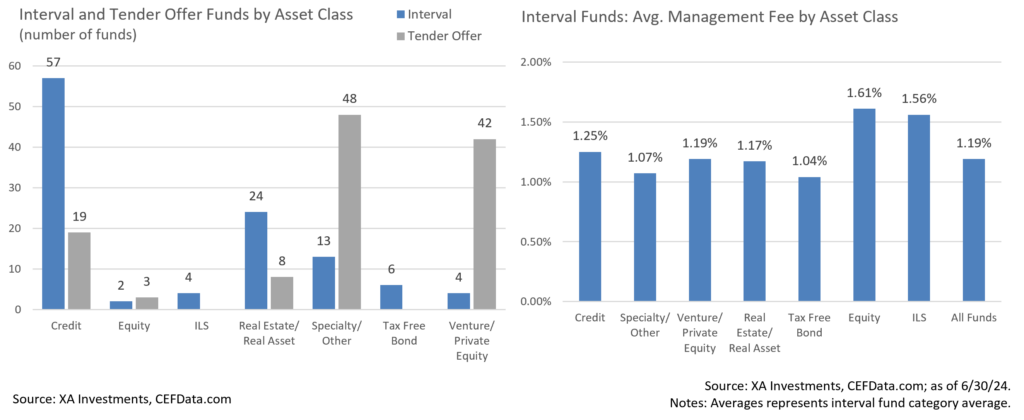
The interval and tender offer marketplace has grown significantly over the last five years with ~230 funds now managing about $150 billion. The market now features many large, highly seasoned managers, including Pantheon, Apollo, Carlyle, Brookfield, and Blackstone. Two-thirds of these funds also now have track records of five years or greater.
Despite growing enthusiasm concerning this space, a few drawbacks are worth considering:
- Although investors are offered periodic liquidity, private market vehicles are still far less liquid than the public markets. Most of these structures also afford the manager an ability to cap liquidity at their discretion, generally ~5% per quarter range.
- Fee rates, though lower than institutional private funds, are still well above traditional ETF and index funds. Most have management fees of 1.00% to 1.50%, while the average is 1.19% (as of 12/31/23).
- Due to their greater liquidity than most other private funds, tender and interval funds tend to carry higher cash balances which may be a drag on returns when private asset valuations are appreciating.
The tender and interval fund subsegment of private markets is an interesting and evolving market that may be of appeal to high-net-worth individuals and families. The Private Client team at Appleton is actively evaluating this space relative to potential opportunities for our clients. If you have questions or interest, please reach out to your Portfolio Manager.
This commentary reflects the opinions of Appleton Partners based on information that we believe to be reliable. It is intended for informational purposes only, and not to suggest any specific performance or results, nor should it be considered investment, financial, tax or other professional advice. It is not an offer or solicitation. Views regarding the economy, securities markets or other specialized areas, like all predictors of future events, cannot be guaranteed to be accurate and may result in economic loss to the investor. While the Adviser believes the outside data sources cited to be credible, it has not independently verified the correctness of any of their inputs or calculations and, therefore, does not warranty the accuracy of any third-party sources or information. Specific securities identified and described may or may not be held in portfolios managed by the Adviser and do not represent all of the securities purchased, sold, or recommended for advisory clients. The reader should not assume that investments in the securities identified and discussed are, were or will be profitable. Any securities identified were selected for illustrative purposes only, as a vehicle for demonstrating investment analysis and decision making. Investment process, strategies, philosophies, allocations, performance composition, target characteristics and other parameters are current as of the date indicated and are subject to change without prior notice. Registration with the SEC should not be construed as an endorsement or an indicator of investment skill acumen or experience. Investments in securities are not insured, protected or guaranteed and may result in loss of income and/or principal.