Insights and Observations
Economic, Public Policy, and Fed Developments
- The markets expected Powell’s Jackson Hole speech to represent a major policy shift, akin to 2022’s “steely resolve to beat inflation.” They were disappointed; Powell’s remarks were neutral enough that both hawks and doves came away believing he was in their camp. We would argue that this actually is a major shift, that the Fed believes rates are restrictive enough to shift to a data dependent response, which is a sharp departure from last year’s iron-clad commitment. Powell indicated he believes more work needs to be done, but that the risks had shifted to growing economic strength more than current inflation readings. We agree on both counts.
- Even after August’s Q2 downward GDP revisions, the US economy has proved to be unexpectedly resilient in the face of the Fed’s interest rate campaign. The second revision showed still-strong 2.1% growth, where a now-familiar combination of tepid business investment and stronger consumer spending netted out to a -0.3% revision from the first. If anything, growth is now accelerating; the Atlanta Fed’s GDPNow tracker currently reads an eye-popping +5.6%, two-thirds of the way through the quarter.
- August’s jobs report was, on the surface, good news for the Fed. It showed a slight upwards beat but with large prior downward revisions, and a surprise jump in the unemployment rate from 3.6% to 3.8%. Below the headlines were two bigger stories, one encouraging, one less so. First, the unemployment rate rose because the workforce increased by 700,000, to 62.8%. This is the highest reading since February 2020 and finally returned workforce participation to pre-pandemic levels. More jobseekers means less upwards wage pressure and a higher potential output for the economy. Both developments are welcome.
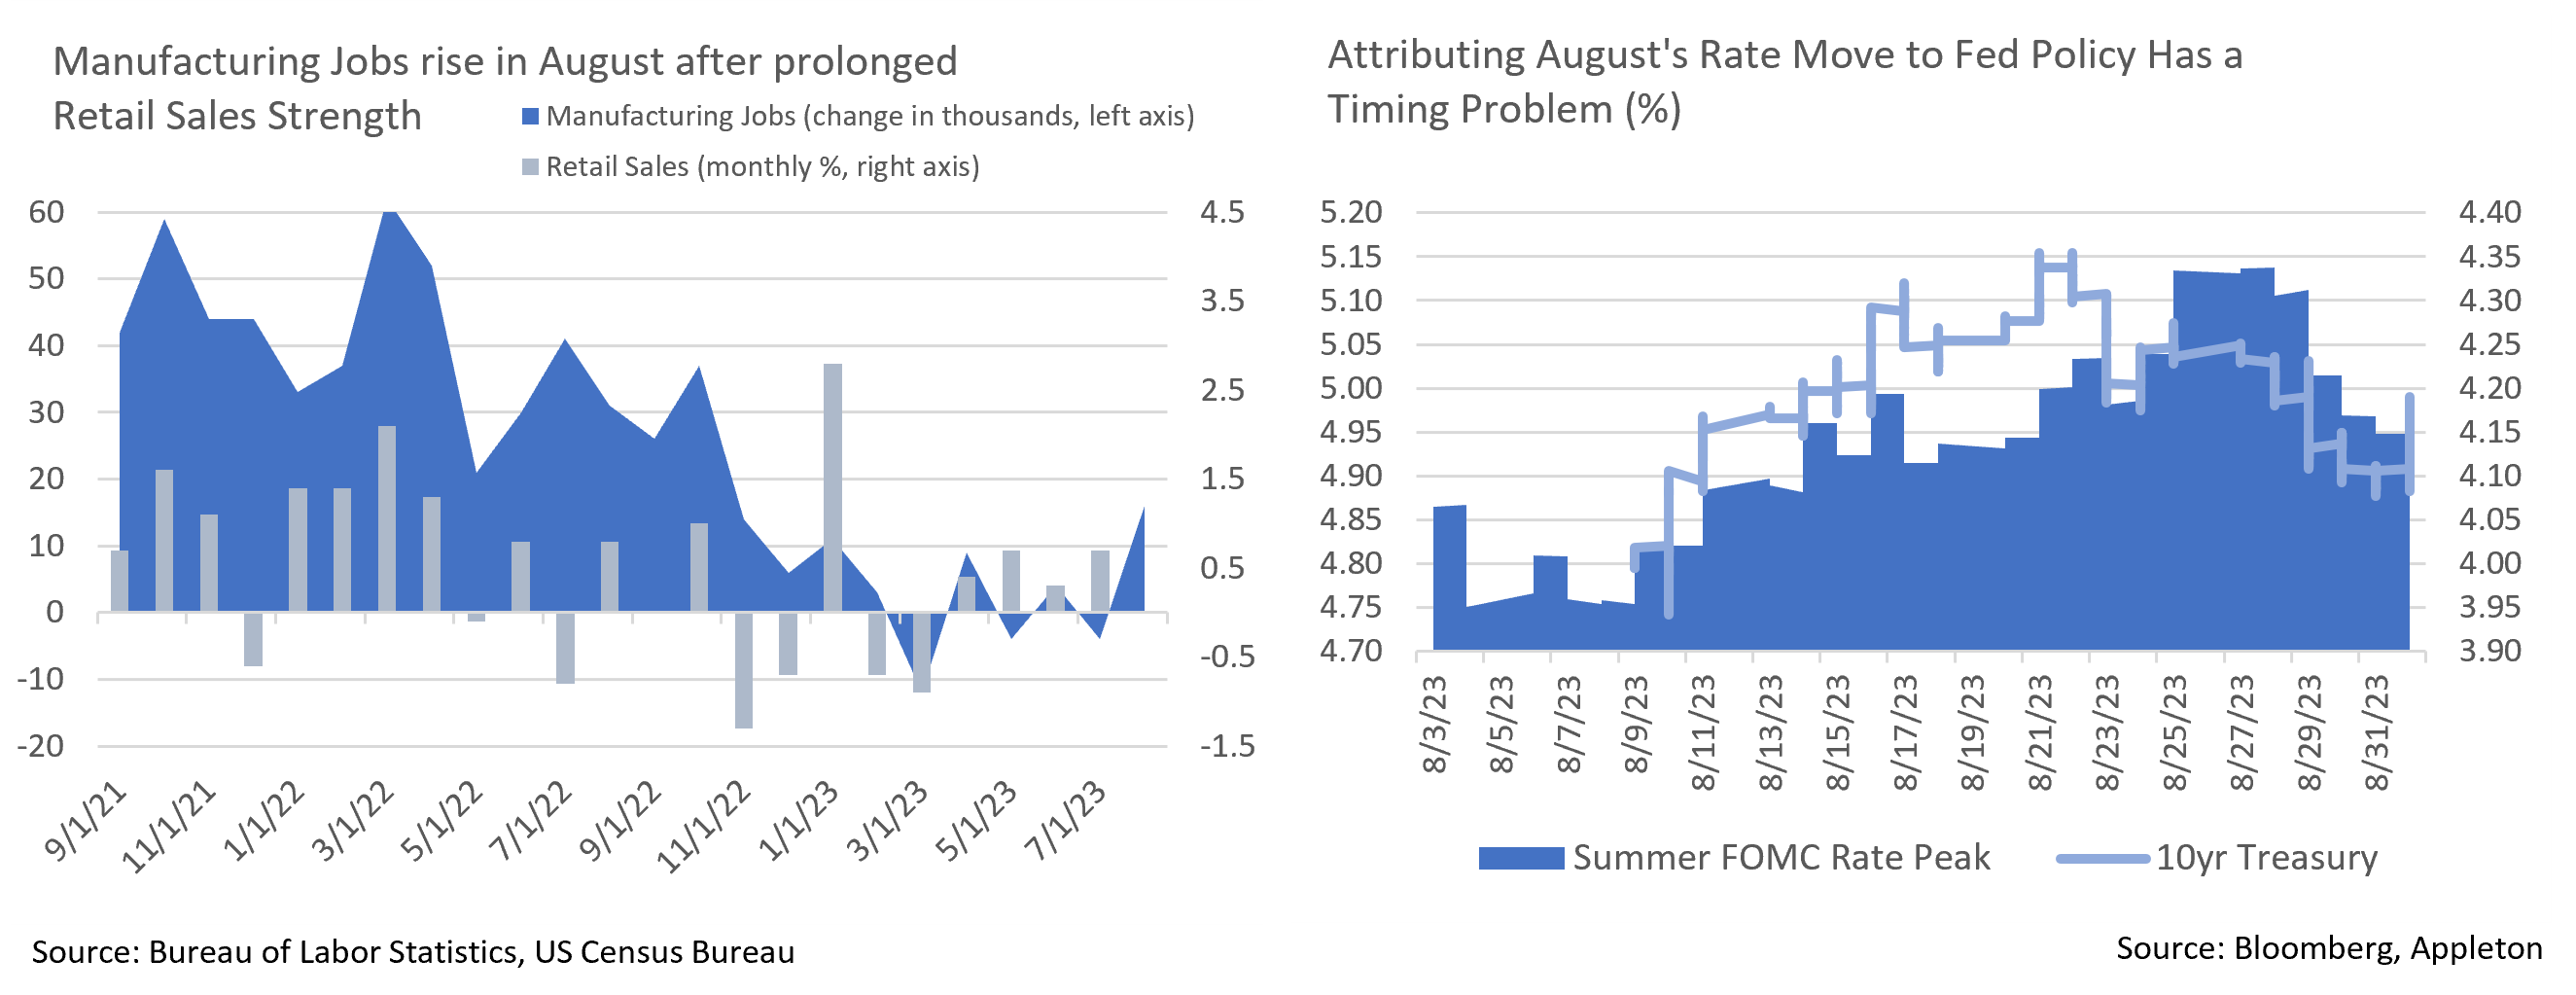
- However, manufacturing employment also jumped an unexpected 16,000 over the month. After several months of strong (goods-heavy) retail spending reports, we had been looking for an uptick in the goods-producing side of the economy. This rise plus an upwards surprise in the August ISM manufacturing report looks like the beginnings of one. With the Fed trying to cool the economy, a re-acceleration in the goods-producing sectors isn’t welcome and could force their hands to hike rates later this year and in early 2024.
- With all eyes now turning to the September FOMC meeting, markets have concluded the Fed will hold rates steady for one additional month, with a November hike possible but not assured. Absent a strong CPI surprise, we agree on September; while we could see the Fed hiking either to send a strong signal that they will not telegraph future moves, or to get ahead of a second wave of inflation from an uptick in economic activity, neither scenario is likely. November may be another story, however, with commodity prices having bottomed and now rising, and with what should be a very strong Q3 GDP report.
- Long term Treasury yields grabbed investor attention in August. After a quiet June and July, the 10Yr broke over 4% and briefly hit the 4.30s, before settling into the 4.10-4.20% range. Commentators at the time attributed this to a hawkish Fed response to strong growth; this explanation feels incomplete, as the peak in yields came a week before the peak in market expectations for the summer of 2024 Fed Funds rate. An upwards shift in the Bank of Japan’s long term rate guidance may instead be the culprit. In any event, there has been strong investor demand above 4.30%, representing levels that have not been available to investors since 2007.
Equity News and Notes
A Look at the Markets
- After posting its best start to a year through July since 1997, the S&P 500 closed lower in August, leaving the index with its first monthly loss since February. The -1.8% decline leaves YTD total return at a still robust +18.7%. Both the Nasdaq and DJIA fell over -2% for the month, whereas the Russell 2000 had its worst month of the year (-5.2%). Looking at sector performance, Energy was alone in the green, rising +1.3% as WTI crude gained 2.2%. The growthier Technology, Communication Services, and Consumer Discretion sectors all closed lower but outperformed the broader market. Defensive, income-oriented Utilities and Consumer Staples were the laggards. Stylistically, Large Growth outperformed Large Value by 193bps on the month, widening the YTD gap to just over 27% (+31.30% vs +4.24%).
- Stocks faced several headwinds in August, the most prominent being a backup in Treasury yields. Despite continued moderation in inflation, growing odds of an economic soft landing produced a repricing of Treasuries with higher yields across the curve. Add in the BoJ yield curve control policy tweak, Fitch’s US debt downgrade, and a glut of supply amid an expanding deficit, and the result was the 10Yr UST reaching its highest level (4.34%) since 2007. The more monetary policy dependent 2Yr followed suit, hitting highs not seen since 2006. Both retraced moderately downward over the last week of the month as softer labor data hinted that Fed policy may be acting with a lag. Higher yields offer an alternative to stocks and make valuations less compelling, yet August’s orderly consolidation suggests that investors are willing to look past them for now.
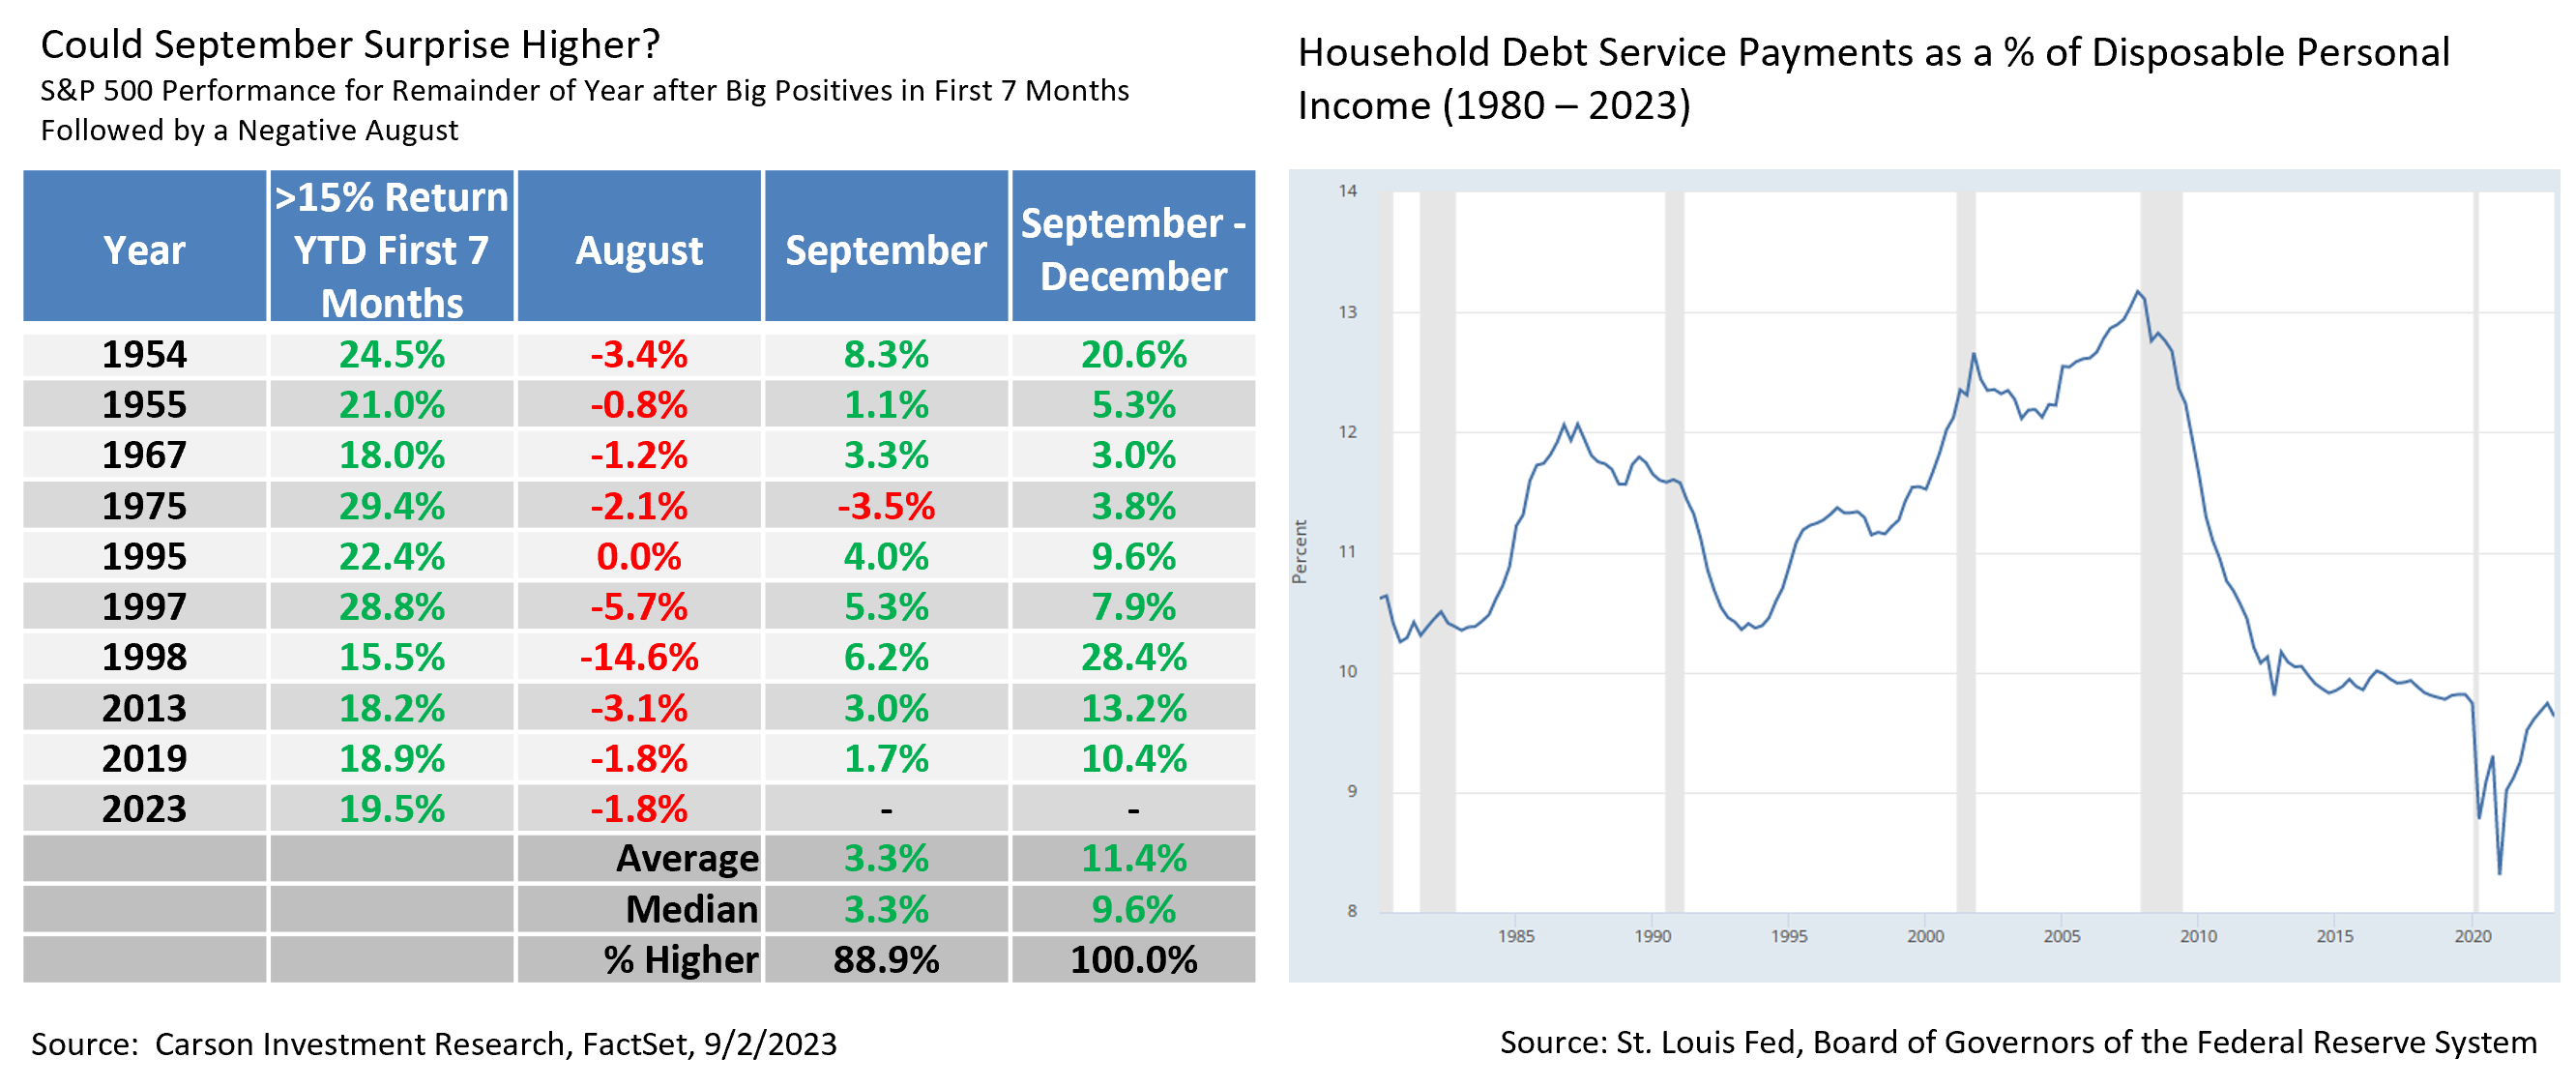
- Investors entered the fall grappling with other bearish headlines. These include economic weakness in China, bank credit downgrades/warnings, labor union strikes, slumping loan demand, mortgage rates hitting 20-year highs, elevated prices at the pump, and US Dollar strength. These clouds on the horizon hit just as market pundits have been talking about negative seasonality. Looking at the past 10 years, the S&P 500 has indeed averaged a loss of -1.53% in September, although a closer look at this data is warranted. Dating back to 1950, when the market is up 15% or more through July and falls in August, the average gain for September was +3.3% and performance over the last 4 months of the year has never been negative. We would not be surprised to see further consolidation of the year’s gains, though seasonality does not need to be a precipitating factor.
- With the odds of a recession fading, many are wondering if consumers can remain resilient, especially in the face of higher interest rates. Consumer credit card debt recently topped $1 trillion for the first time concurrently with credit card rates hitting a record. That only tells one side of the story. Consumer net worth is also at a record high, so when assessing the consumer’s ability to service their household debt, the picture becomes much less alarming. The resumption of student loan payments this fall will impact many consumers, but until we see a meaningful slowdown in the labor market, spending is likely to remain strong enough to prop up the economy and corporate profits.
- With Q2 earnings season complete, a look back shows EPS growth came in at -4.1%, the third straight quarter of contraction. However, results were not as bad as feared and corporate earnings expectations for the remainder of 2023 and 2024 have stabilized. This will be a key metric to track going forward. The stock market’s YTD gains have come on the back of multiple expansion rather than earnings growth and we believe earnings growth will need to resume to maintain or grow current multiples.
From the Trading Desk
Municipal Markets
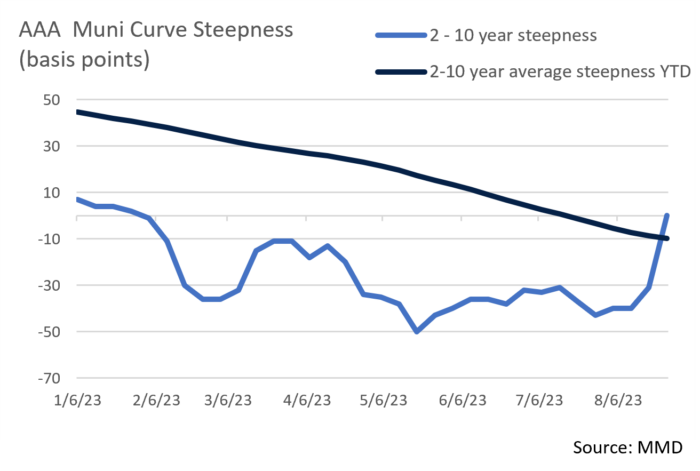
- Despite the Treasury yield curve experiencing numerous curve inversions since the 1980’s, the municipal curve had always been upward sloping until December 2022. At that time, the 2 to 10-year curve inverted, with a max spread differential of -48bps occurring in May. As August drew to a close, 2-10s remain inverted at -25bps, somewhat flatter than the -42bps differential seen at the beginning of the month.
- The inversion pivot point on the curve where yields begin to increase and incremental returns can be captured has recently shortened, creating value opportunities in the 7 to 10-year range that have not been available in recent months.
- The September 30-day new issue calendar is expected to be about $26.8 billion, with $9.1 billion anticipated this week. The new issuance docket is currently being led by the State of California ($2.6 billion) and the Port Authority of NY & NJ ($1 billion), two issuers of considerable interest to Appleton.
- August’s tax-exempt issuance of $35 billion was 15% above August 2022, although YTD gross issuance of $240 billion remains 13% below the same period of 2022. Tax exempt supply of $214 billion has come in 6% lower on a YTD basis vs. 2022 but is in line with the 5-year average. Primary market inventory is still tight and new offerings often remain oversubscribed.
- September not only brings with it the onset of fall, but also a period of market technical factors that we believe will be more supportive than usual. September marks the end of a high summer period of reinvested coupon payments and typically introduces greater issuance. However, in the current rate environment, issuers have been discouraged from coming to the market and this diminished supply coupled with sustained demand at attractive nominal yield levels may lead to favorable technicals.
Corporate Bond Markets
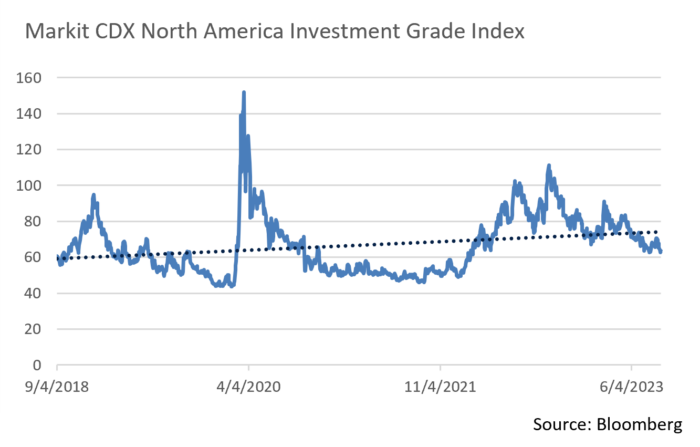
- The High-Grade credit markets, as measured by the Markit CDX index, have exhibited sustained strength since mid-May with spreads hitting a YTD low of 63 at the end of July. That path veered moderately off course in August as the index briefly touched 71 only to return to YTD lows. The last time the index touched these lows was back in early February of 2022 just before the Federal Reserve began its current tightening cycle.
- We feel the market is signaling that investors believe the Fed may be close to the tail end of its rate hike cycle, as the cost of protection against a credit default has fallen. Forthcoming economic data will likely create further volatility, although demand should keep spreads in check.
- Credit spreads have largely been stable over the past couple of months. The OAS on the Bloomberg Barclays US Corporate Index began August by touching a YTD low of 112bps before retracing to 118bps to close the month. The average OAS over the past 5 years is 123bps and we expect credit spreads to remain range bound over the near term. This view is predicated on sustained primary and secondary market appetite, an end to the rate hike cycle, and economic stability. Even though a breakout in spreads is unlikely, we favor quality given the persistence of volatility and the tendency of higher rated credits to better withstand market swings.
- Last month’s $65 billion in new High-Grade bond offerings fell short of expectations as Treasury volatility kept many issuers on the sidelines. A more stable rate environment, combined with a positive credit tone, should bolster the new issue market going forward with an estimated $120 billion expected in September. Much of this new supply should hit right after the Labor Day weekend and well ahead of the September 20th Fed meeting. We will be watching credit appetite closely but expect more than ample investor demand.
Financial Planning Perspectives
Will Social Security As We Know It Make It To 100?
An Age-Old Entitlement Program Faces Funding Pressures
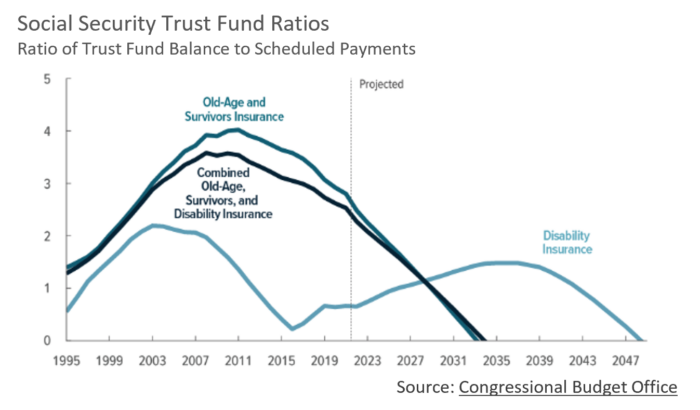 Social Security, a mainstay of American retirement life for decades, has been in the headlines repeatedly over the past year. Current and future recipients were likely pleased to see the largest cost of living adjustment (COLA) since 1981, although the 2023 Social Security Trustees’ Report released earlier this year indicated that, absent substantive changes, the Social Security Trust Fund (Old-Age and Survivors Insurance-OASI) is an estimated 11 years away from being insolvent.1 While hardly the first such warning, this is alarming nonetheless as an aging population plans for retirement.
The Social Security Act originally passed in August of 1935 as part of President Franklin Roosevelt’s “New Deal” with America. The original Social Security Act was limited in scope and only paid benefits for retired workers aged 65 or older. According to the Social Security Administration (SSA), in 1940 the ratio of Covered Workers contributing to the benefit pool to Beneficiaries receiving them was 159.4x (33.39 million workers vs. 222k beneficiaries), a demographic strength that has changed considerably as the population ages. Over the years, the scope of the Act has also been expanded to include benefits for seniors who continue to be employed at age 62, spouses and widows, disabled workers, divorcees, and surviving minor children of deceased workers.
Demographics are Exacerbating Long-Term Stability
While expansion may have made sense at the time, the cumulative effect of these changes coupled with rapidly evolving demographics have compromised the fiscal foundation of Social Security. In fact, the SSA estimates that the ratio of Covered Workers to Beneficiaries shrank to just 2.8x in 2022 and today the SSA administers over “$1.3T in benefits and payments to more than 70 million beneficiaries.”2 With fewer workers contributing, the gap between outlays and income is steadily increasing, fueling the risk of insolvency by 2033.3
According to the Social Security Trustees Report, absent meaningful changes to the Social Security program, beneficiaries of all ages and incomes could face a 20% across the board cut in benefits. The non-partisan Committee for a Responsible Federal Budget has estimated that a median newly retired couple would receive $17,400 less per year.
While these funding concerns may be disconcerting, similar (and perhaps far worse) circumstances existed for the Social Security program in the late-1970s. To address the ongoing financial viability of Social Security, President Reagan and Congress appointed the National Commission on Social Security Reform to make actionable funding solvency recommendations. The Commission’s 1983 report called for increasing payroll taxes and raising the retirement age for full benefit eligibility from age 65 to 67 beginning in 2027 by increasing the full retirement age two months each year from 2000 to 2022. These changes were incorporated into the bi-partisan Social Security Amendments of 1983.
Now 40 years later, the program’s viability once again requires political decisions. While bipartisanship in Washington, D.C. is at a premium these days, our hope is that Congressional leaders will again come together to save the Social Security well in advance of 2033. Several proposals are being floated, including increasing payroll taxes (up to $160,200 of an individual’s earnings are currently subject to the 6.2% employee payroll tax), raising the retirement age to age 70, and decreasing benefits for high earners.
Public Angst Is Growing
Concern over the future stability of the Social Security Trust Fund, which funds retiree benefits, was made clear in a recent study by Schroders. While 90% of survey respondents indicated that they plan to claim Social Security benefits before age 70, 44% indicated the reason for not waiting to receive benefits until full retirement age or at age 70 was because they fear the program will run out of money!4
While Social Security can be a meaningful part of the retirement income puzzle, we recommend that clients seek to build a diversified stream of income and that they not rely heavily on any single source to support them through their retirement.
- https://www.ssa.gov/OACT/TR/2023/trTOC.html; 2. https://blog.ssa.gov/celebrating-88-years-of-social-security/; 3. Social Security Trustees Report (2023);
- https://www.schroders.com/en-us/us/individual/media-center/just-10-of-non-retired-americans-will-wait-until-70-to-take-maximum-social-security-benefits/
For questions concerning our financial planning or wealth management services, please contact:
Jim O’Neil, Managing Director
617-338-0700 x775 | [email protected]


