Insights and Observations
Economic, Public Policy, and Fed Developments
- President Trump signed a permanent spending bill on February 11th, averting the possibility of a second shutdown, but then declared a national emergency to secure funding for his border wall. A resolution overturning the declaration cleared the House and will likely also pass the Senate, but not by veto-proof majorities. Although this matter may require court intervention to resolve, for now a significant political overhang has been removed from the market.
- Citing significant progress in negotiations, Trump indefinitely extended his March 1st deadline for the re-imposition of tariffs on China. This welcome news came after he previously indicated he would not do so without concessions, including an agreement on intellectual property (IP) protections that is apparently considered a nonstarter by Chinese negotiators. No details were released and the only firm commitments from the Chinese are expanded agricultural and energy purchases and a promise to not devalue the yuan. While administration officials have sounded optimistic, and trade headlines as markets opened on March 4th were favorable, the extension suggests negotiations may not be going especially well. We feel the potential of a deal with significant IP protections and major structural reforms remains low. However, the market will likely greet even a limited deal with relief, as it would take the risk of further tariff increases off the table.
- Q4’s delayed GDP report came in unexpectedly strong, 2.6% vs. Bloomberg consensus of 2.2% and slightly above our anticipated range of 2-2.5%. A slowdown in private inventory investment and government spending were responsible for the widely expected drop from Q3, although this was a good report that further discounts near-term recession risk.
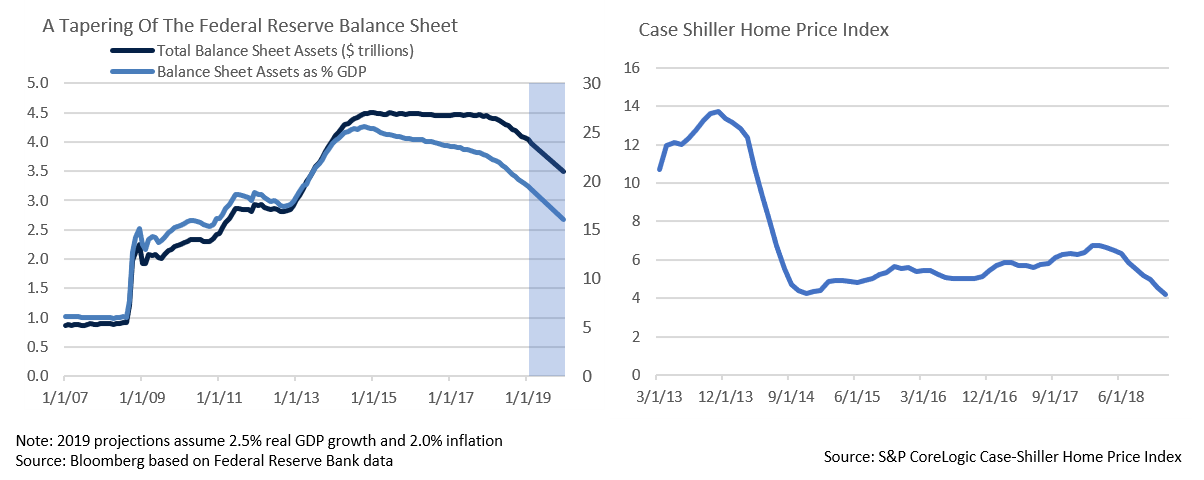
- Chairman Powell’s February Congressional testimony soothed the markets on two fronts. He continued to emphasize that so long as inflation remained muted the Fed can wait and see how economic conditions develop and the markets behave before adjusting interest rates. Powell also repeatedly referred to an average, rather than a maximum, inflation target, thereby opening the door to potentially allowing inflation to exceed 2% for a period. The Chairman’s testimony and January FOMC minutes also indicated that the Fed believes they will complete balance sheet reduction by the end of 2019, with policy guidance coming as soon as March. While the Fed’s balance sheet will remain elevated relative to pre-crisis levels, likely around $3.5-3.6 trillion vs $0.9 trillion, as a % of GDP it has already declined from a high of 25.6% to 19.1% and will likely end 2019 around 16%. A slower pace of Fed asset sales than once anticipated mitigates monetary policy tightening and potentially upward pressure on interest rates.
- While most of the economic picture remains solid, two concerning trends merit close attention. First, an all-time high 7 million Americans are currently 3 months or more behind on car payments. Second, sales of existing homes are continuing to slow, particularly in high tax states. The National Association of Realtors median existing single-family home index and the Case Shiller index dropped by 4% and 4.2%, respectively, while Toll Brothers, a builder of luxury homes, saw a 24% decline in Q4 new orders, with a 62% drop in California. Solid wage gains and recent declines in interest rates should improve affordability, although housing sales are considered an economic leading indicator and unexpected further weakness could foreshadow a greater economic slowdown than the recently experienced slight cooling. This is not our current base case, however.

Equity News & Notes
Earnings Move To The Forefront After A Strong Post-December Rally
- The stock market has continued its furious rally off the Christmas Eve low on the back of three main drivers: optimism concerning a potential trade deal with China; the Federal Reserve pivoting to a more patient monetary policy; and a “better-than-feared” Q4 earnings season. As of the end of February, the S&P 500 was up +11.5% YTD (+19% since the December lows), the best 2-month start since 1991 and its fifth best start on record.
- Market breadth has also been strong as evidenced by a host of indicators: small caps are up 17% YTD; the advance/decline line is at all-time highs; all 11 sectors were positive in back-to back months for the first time since 2013; and the equal-weighted S&P 500’s return of +13.8% exceeds the market cap weighted S&P 500 by over 2%. Historically, strong breadth bodes well for near-term returns. However, we recommend caution as several technical indicators suggest we might be running a little hot: 90% of the S&P 500 components are now above their 50-day moving average; the Index itself is 6% above its own 50-day moving average; and a relative strength index reading of over 70 is at a level that historically signals an overbought condition. We believe the market might need to digest its gains before legging higher.
- Analysts had lowered their earnings estimates dramatically in the months leading up Q4 earnings season, with a 16.3% aggregate earnings growth projection of 9/30/18 falling to 10.6% by the time reporting began in mid-January. Although somewhat counterintuitive, investors often benefit from a “lowered bar.” Seeing this dynamic play out led us to categorize Q4 earnings season as “better-than-feared” given that 13.4% earnings growth exceeded a reduced expectations hurdle. Largely as a result, the average stock gained 0.65% on earnings announcement day, the best reaction since Q4 of 2013. (Source: Bespoke)
- So how is Q1 ’19 shaping up? Wall Street analysts currently expect earnings growth to decline by 3.2% (as compared to a +6.3% projection back in 9/30/18), largely due to slowing global economic growth and ongoing trade concerns. How much is there to fear should we experience an earnings recession (negative growth for 2 consecutive quarters)? As the accompanying chart reveals, 2015-16 saw a 4 quarter stretch of negative earnings growth, although an economic recession did not materialize. The S&P 500 was flat in 2015 (+1.4%) and enjoyed a +11.9% gain in 2016. It should be emphasized that a strong relationship between earnings recessions and economic recessions does not exist, as only 9 out of the 22 earnings most recent recessions preceded an economic recession. (Source: Lord Abbett)
- A key question facing investors is whether all the good news is already priced into the market. At 16.4x forward 12-month earnings, S&P 500 valuation is by no means extended, although it is not nearly as attractive as it was entering the year. From a technical standpoint, the market is also bumping up against a 2,800 resistance point. Valuation expansion will only go so far, and regaining earnings momentum will likely be necessary to push the equity markets upward.

From the Trading Desk
Municipal Markets
- High grade municipals continue to be elusive in this low supply/high demand environment. While supportive of performance, this tight market presents investment challenges. For the month of February, muni issuance was just $17.99 billion, about 30% behind last year’s numbers. 30-day visible supply is hovering in the $8 billion range, which suggests that issuance going forward will also be limited.
- The demand side of the equation remains strong, perhaps best exemplified by net YTD inflows into municipal mutual funds of more than $12.4 billion, a figure that more than offsets outflows incurred over the second half of last year. High quality names continue to be oversubscribed, resulting in partial allocations, an added challenge to getting cash invested.
- Against this strong technical backdrop, the 10-year Muni/Treasury ratio currently stands at 77%, the lowest level since 2010. Although this may prompt relative value questions, the tax-advantaged income and portfolio stability offered by municipals remains in demand, particularly given a growing recognition of the State and Local Tax (SALT) deduction limitation’s impact in high state taxes. A solid environment for municipal performance persists in our view and, as a frame of reference, the 10-year Muni/Treasury ratio averaged just above 78% for much of the 1990s.
- A seasonal adjustment in SIFMA/VRDN rates is ongoing, impacting tax-exempt short-term investment choices (a subject we wrote about last April, “Optimizing Short-Term Investment Assets”). As we approach tax time, investors often sell cash equivalents to pay tax bills, thereby causing the rates on those instruments to increase. This adjustment is especially notable this year given additional tax burdens resulting from the $10,000 cap on State and Local Tax (SALT) deductions. As we write, the SIFMA Municipal Swap Index is yielding 1.67%. Where SIFMA yields go from here is unknown, although we foresee rate resets at higher levels. Selling pressure is anticipated until these securities attract substantial demand from crossover buyers. Crossover buyers will likely be comparing it to LIBOR, which may ultimately act as a cap on SIFMA reset rates. Nonetheless, in today’s environment VRDNs present an attractive, high quality, tax-efficient option for short-term liquid holdings.

Taxable Markets
- The tone in investment grade credit continues to be strong. After a challenging end to 2018, market appetite for corporate credits has rebounded and compressed spreads to levels not seen since November of 2018. B of A/Merrill Lynch US Corporate Master OAS receded to 129 basis points at the end of February. The Fed’s pivot towards a more dovish tone and a feeling that the year-end credit sell-off was overblown have been key drivers. According to Bloomberg Barclays, US IG credit has returned 2.68% YTD through February and US High Yield returned 6.27% over the same period.
- Investment Grade credit ratings are also strengthening, as the number of Moody’s upgrades has recently far outpaced downgrades. So far this quarter there have been 31 upgrades and only 8 downgrades, a highly favorable 3.88/1 ratio. This compares to a 10-year average is 1.57 and reflects positively on overall credit trends.
Financial Planning Perspectives
Maximize Your Retirement Savings
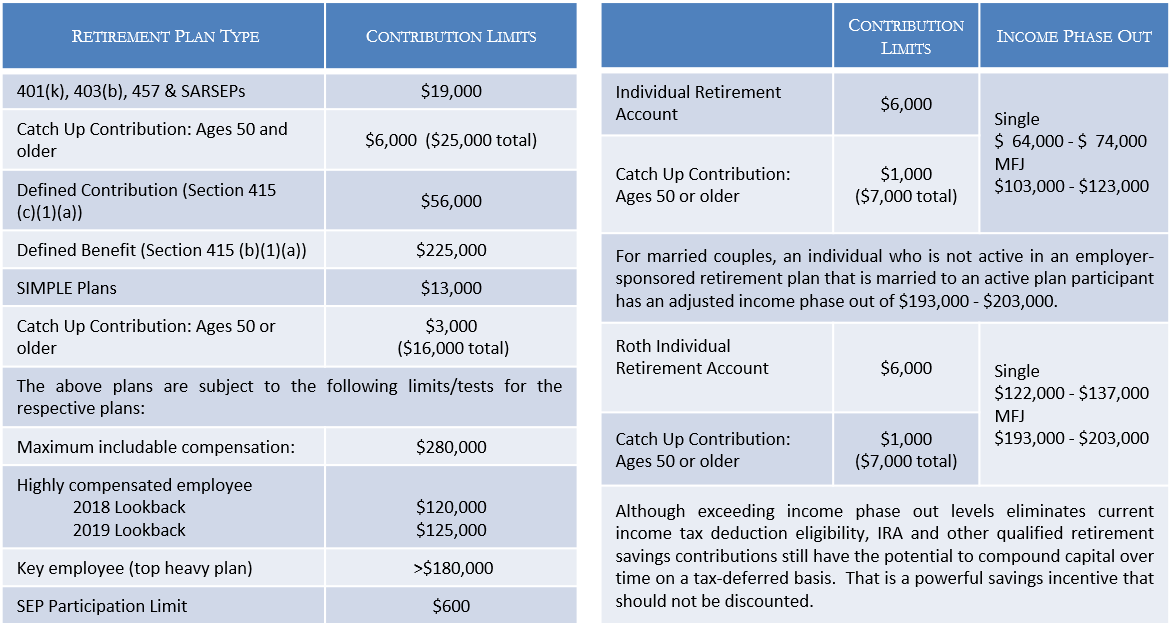
Even though New England’s week started with a snowstorm, Spring isn’t too far around the corner. As many of you are placing the finishing touches on 2018 federal and state income tax returns, we thought it would be a great time to review the retirement account contribution and income phase-out limits. Maximizing the potential of retirement savings strategies is an important element of long-term financial planning and can also help reduce current tax obligations.


For questions concerning our financial planning or wealth management services, please contact
Jim O’Neil, Managing Director, 617-338-0700 x775, [email protected]


