Insights and Observations
Economic, Public Policy, and Fed Developments
- Geopolitical turmoil took center stage in February when Russia invaded Ukraine on the 24th. From Ukrainian president Volodymyr Zelenskyy’s now-famous “I need ammunition, not a ride,” to millennials posting tutorials to TikTok on how to operate abandoned Russian tanks, the courage and resolve of Ukrainians has captured global imagination and we share hopes for peace, preservation of Ukraine’s national sovereignty, and protection of her citizens.
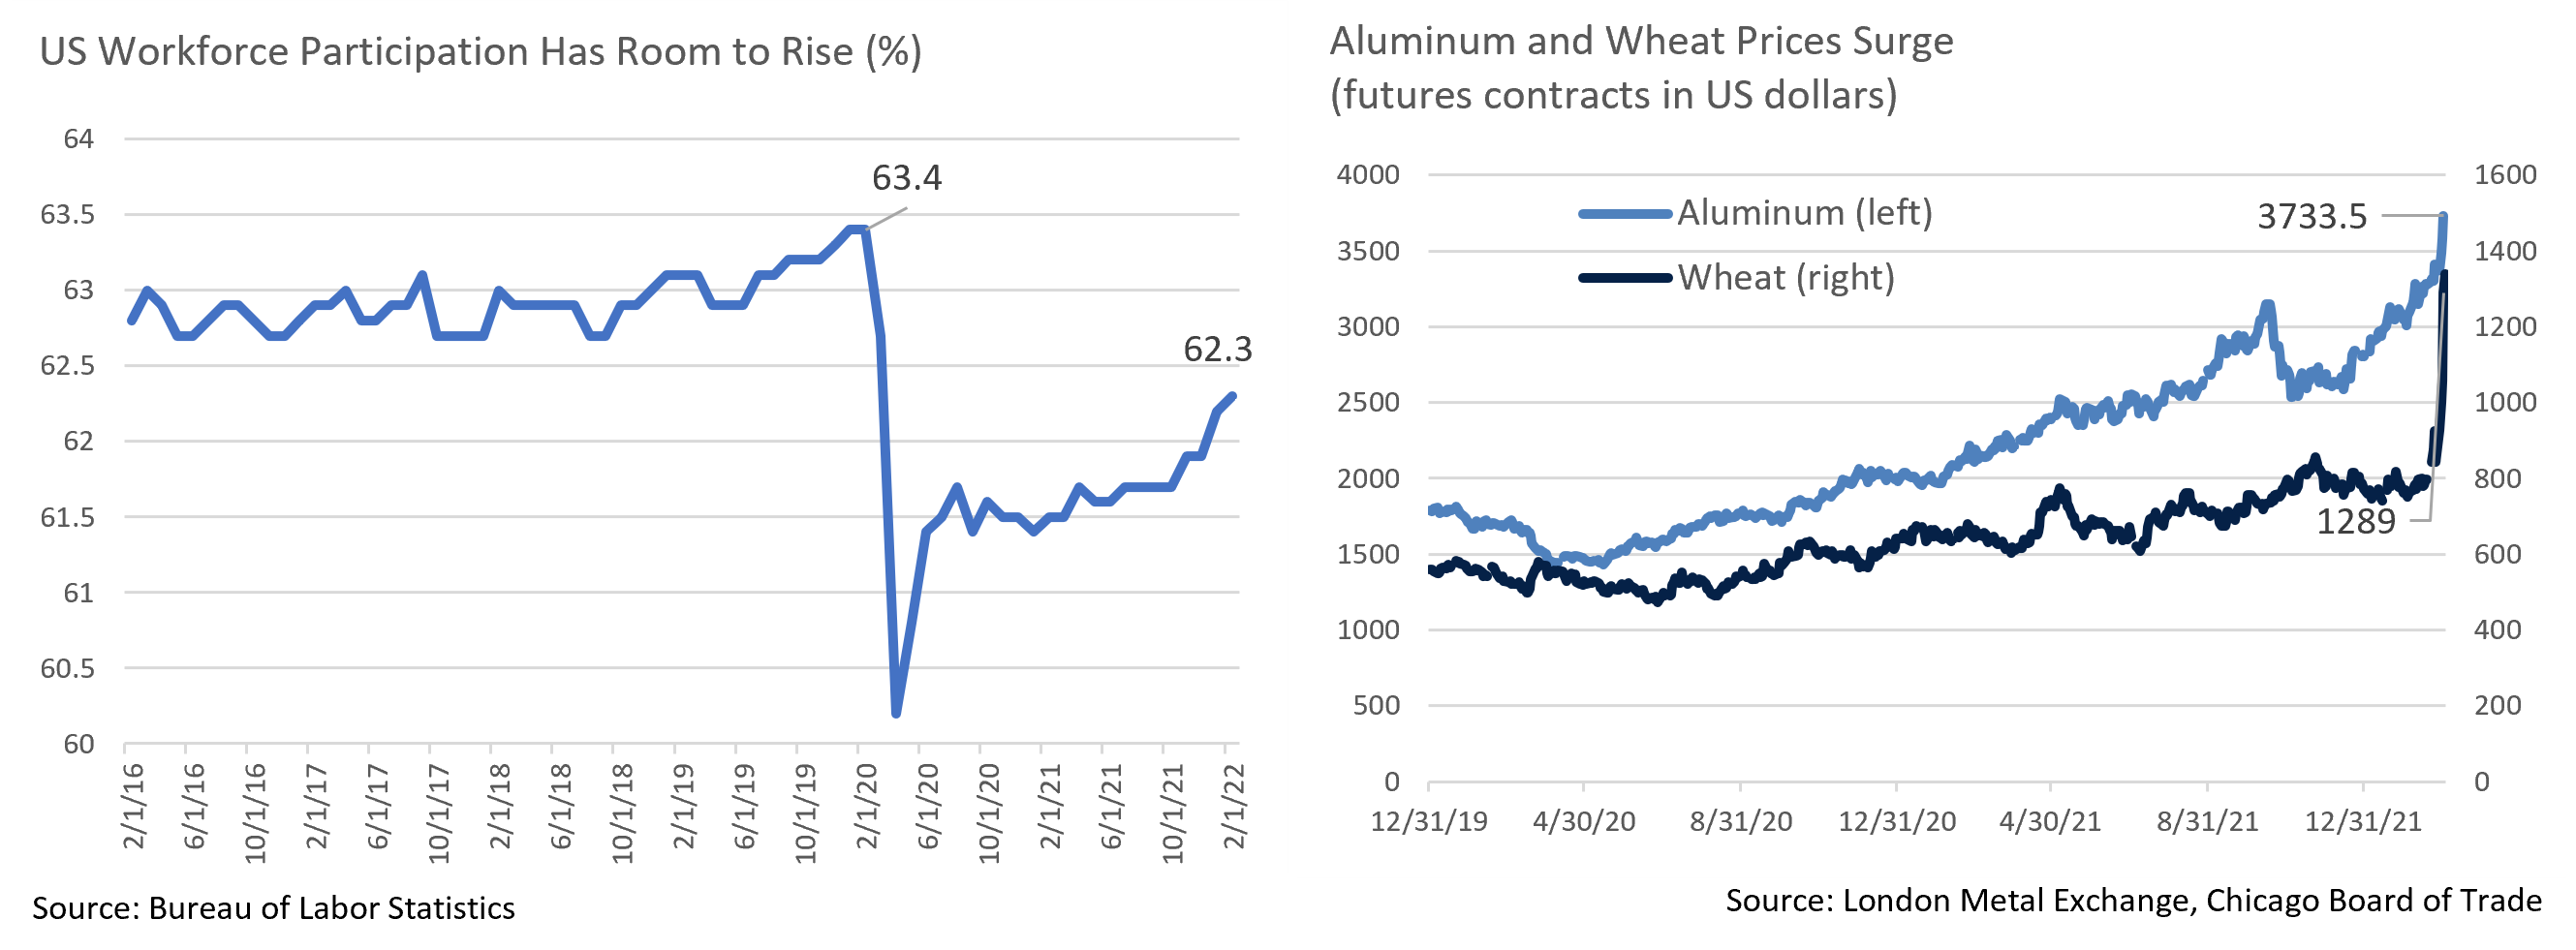
- The ensuing risk-off trade reversed recent Treasury weakness and pulled yields back below 2%. Prices have been rising for some time in commodities where Russia or Ukraine are major players as oil crested above $130/barrel, aluminum reached all-time highs, and corn and wheat – Russia and Ukraine together produce 20% of global supply – rose on supply disruptions. The near-term impact of war is likely to be inflationary, even though longer term its effects are less certain.
- Ironically, despite this initial inflationary bias, market expectations for Fed Funds rate hikes began to reverse and fall after war broke out. We believe this was driven by a diversion in the market’s attention rather than any fundamental reassessment of inflation risk, as the rate hike trade had gotten increasingly crowded in recent weeks. Chairman Powell’s remarks on March 2nd committing to a hike at the March meeting stabilized the markets somewhat but the initial reaction is one more reason to think Fed Funds rate expectations are currently too aggressive.
- The CPI print at the start of February surprised to the upside, +0.6% vs. +0.4% on a monthly basis and +7.5% vs. +7.2% annually. The details were not as bad as the headline suggests; a downtrend in monthly prints is still – barely – in place, and most of the upside surprise was driven by pandemic-sensitive categories. Less related categories such as owner’s equivalent rent remain stable though elevated relative to historical norms, something that demands close attention in coming months.
- While retail sales began the month by surprising to the upside at +3.8% vs +2.0%, this report is heavily biased towards goods spending, and came on the back of downward December revisions from -1.9% to -2.5% and in November from +0.7% to +0.2%. January’s nominal level of retail sales was not much higher than expected despite a large monthly increase. Weak restaurant and bar sales suggested January’s strength may have been driven by Omicron diverting spending from services to goods.
- Consumer spending and personal income reports at month-end provided further evidence of this substitution; while goods consumption was strong at +4.3% (+21.3% in auto spending as supply chains improved), services growth was nearly negligible at +0.1%. Flat income growth due to child tax credit expirations offsetting wage increases influenced a savings rate decline from 8.2% to 6.4%, the lowest level since 2013. With a falling savings rate, current levels of spending are not sustainable without workforce growth.
- The BLS jobs report released on March 4th came in unexpectedly strong, 678k new jobs vs. expectations of 423k. Typically, upside surprises like this are considered evidence of a too-hot economy, however with the labor force still nearly 1.2 million below February 2020’s peak, last month’s combination of strong jobs momentum, labor participation growth, and flat wage data is likely to take some pressure off the Fed. Although we do not believe it will reduce the likelihood of a March rate hike, higher labor participation should ultimately help moderate inflation.


From the Trading Desk
Municipal Markets
- Over the course of the month, AAA municipal yields rose, and the curve flattened. The short end of the curve increased 16bps despite lagging USTs, while the 10Yr AAA increased a much more modest 3bps. The spread between 2s and 10s began February at 64 bps but narrowed to 52 bps by month’s end. The yield curve reaction we saw is to be expected given a high likelihood of forthcoming Fed Funds rate hikes.
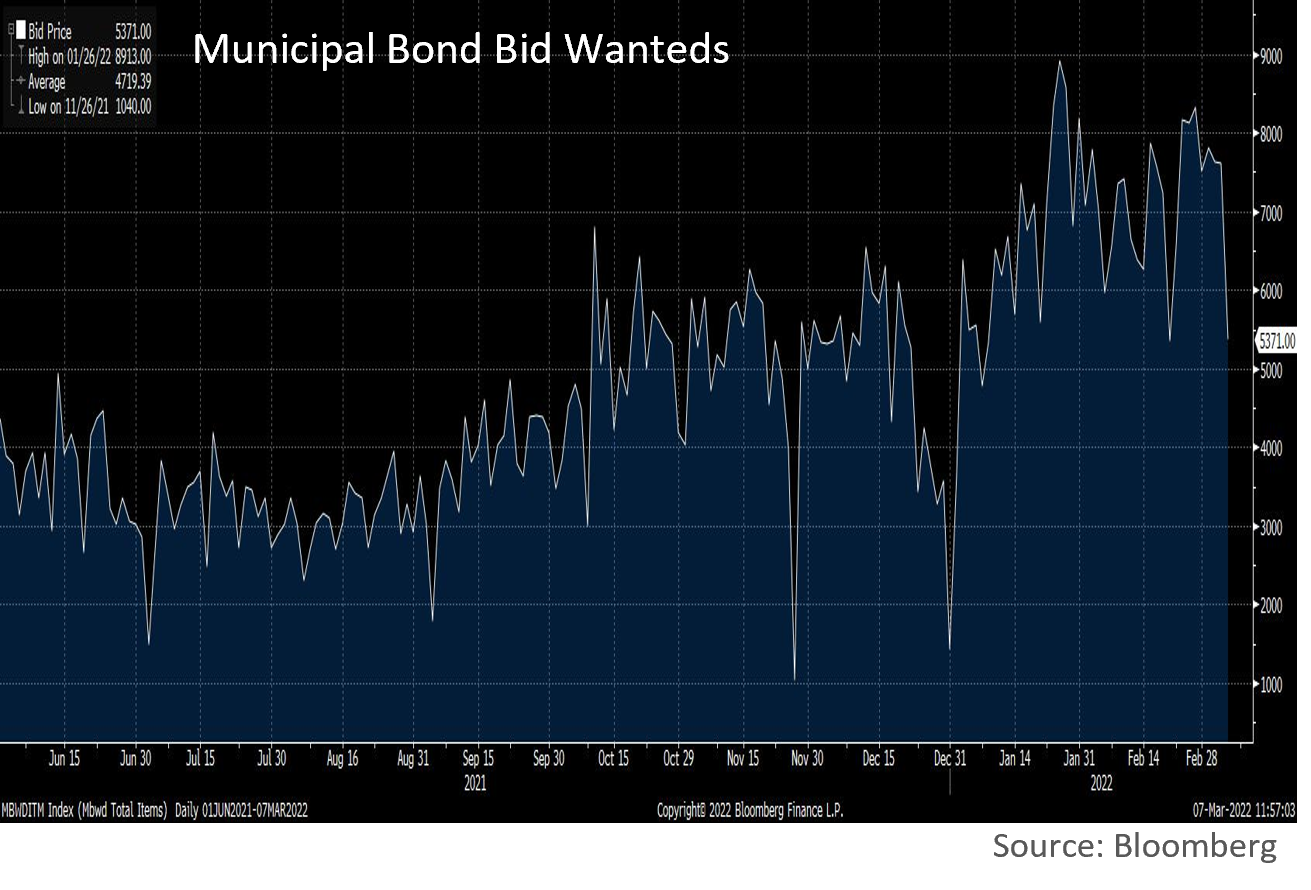
- Bloomberg reports a significant increase in the number of bid wanted items this year, with a daily average of 6,723 up sharply from the prior year’s average of 4,126. An increased volume of bonds out for bid is often a reflection of market volatility, and we see opportunities for tax-exempt investors.
- Retail investor sentiment has been impacted by inflation and rate concerns, as evidenced by an 8th consecutive week of mutual fund outflows. We started 2022 with a week of inflows, although since that time net outflows have totaled almost $12.6 billion. April tax payments typically contribute to relatively weak flows during March and April, a dynamic that is likely to extend the recent demand downturn. Although this may add to upward yield pressure, more attractive values are becoming available in quality bond issues we like from a credit standpoint.
- The 10Yr AAA municipals/UST ratio is a common relative value indicator and can influence investors attempting to hedge their exposures. Municipal yields are significantly impacted by supply and demand dynamics along with the direction of USTs and are thus generally slower and less reactive than USTs. In times of increased volatility, as UST yields are moving, the 10Yr AAA ratio also tends to be volatile. We have seen this recently given flight to quality trading in USTs. Recently elevated ratios should dampen the impact of rising UST yields on municipals.

Corporate Bond Markets
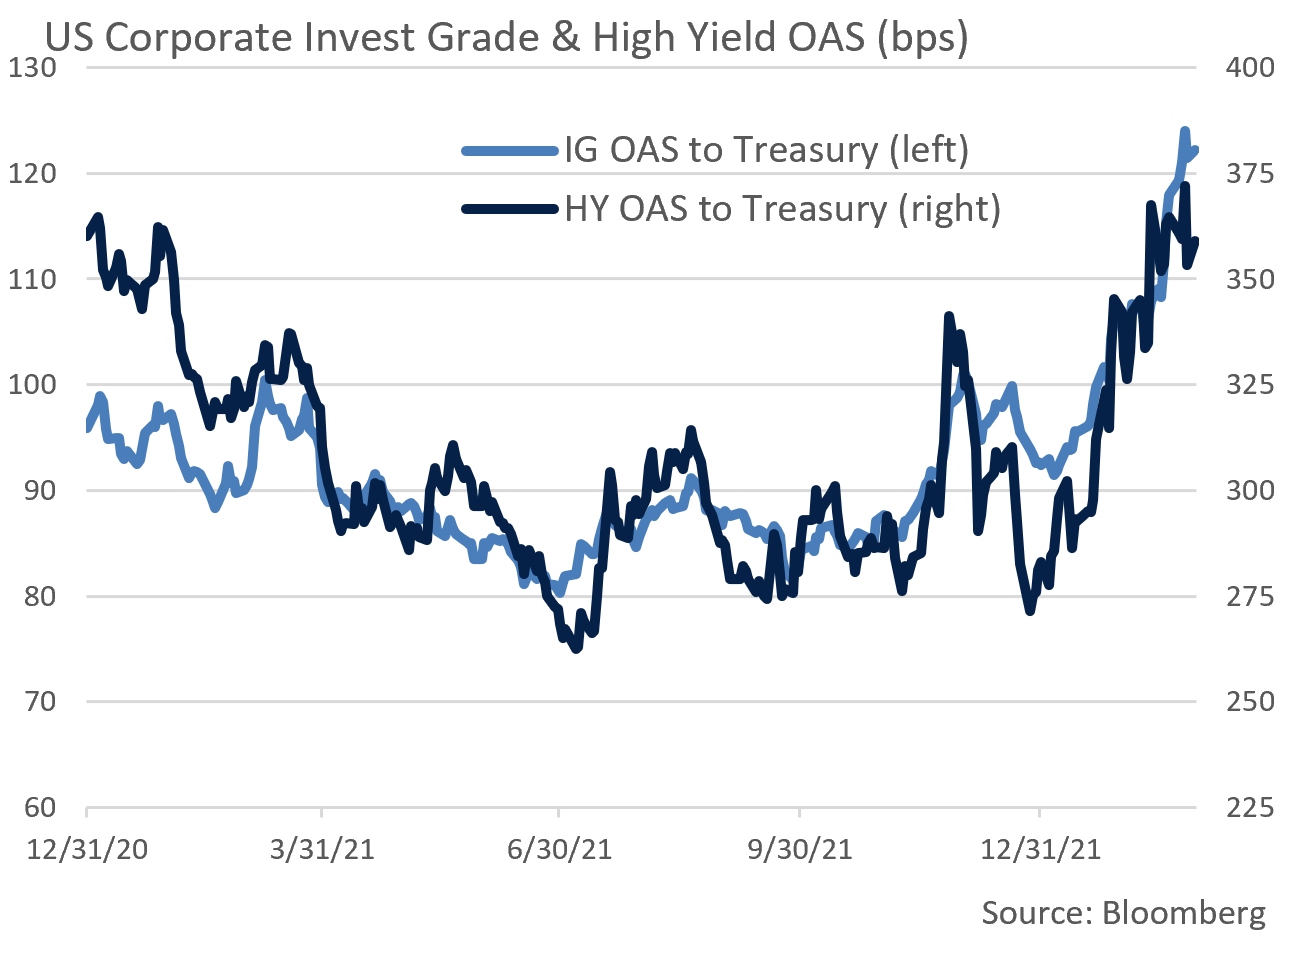
- Given an almost unimaginable geopolitical crisis in the Ukraine, a risk-off tone was not surprisingly a catalyst for Investment Grade and High Yield corporate credit spread widening. A muted move in IG spreads at the beginning of the month accelerated by the second week as events in Eastern Europe unfolded. OAS widened by 19 bps on the month, ending at 124 bps, the widest levels since November of 2020. As is often the case, lower quality bonds experienced the greatest spread movement and, with just over 50% of the Bloomberg Barclays US Corporate Bond Index comprised of lower quality names, benchmark performance was impacted. We anticipate spreads stabilizing over coming weeks given a still solid economic and corporate credit outlook, although we share concern about the implications of war in Ukraine.
- In this environment, the primary market has recently experienced ebbs and flows of supply and demand. Current uncertainty and volatility has pressured corporate issuers to find opportune times to come to market. Last month’s $84 billion of new IG supply fell well short of expectations, and the price concessions required to sell bond offerings were noticeably higher. Credit spread stability likely requires the primary market to regain its footing.
- Street consensus for March supply of roughly $150 billion may not be reached if market tone remains risk averse. Historically, major geopolitical events are highly unsettling but tend to be relatively brief. If that once again proves to be the case, we anticipate an above average Q2 issuance calendar with spreads and market demand regaining traction.
- Within our High-Grade Intermediate Government/Credit strategy, the extent to which duration changes as interest rates move, also known as convexity, tends to be modest. This has historically helped mitigate risk, largely due to our emphasis on higher coupon bonds and intermediate curve positioning. In times like these, we are diligently focused on high quality credits and maintain a long-term investment horizon.

Public Sector Watch
Credit Comments
Oil and Gas Prices Are Impacting Tax Policies
- Oil prices recently hit their highest levels since 2014 following the invasion of Ukraine and the subsequent imposition of aggressive sanctions on Russia. We expect market disruption associated with the conflict and Western sanctions to keep oil prices at highly elevated levels and prices may spike even higher should the war escalate.
- Energy has been a major contributor to troubling inflation readings which in January reached a +7.5% annualized rate. Oil is a commodity with impact across the supply chain, affecting everything from airfares to food, and most directly the price consumers pay for gas at the pump. Americans are now paying twice as much as in the early pandemic period.
- The Federal government and individual states are deploying various tools to try and mitigate inflation. On March 1st, the US and other major oil-consuming nations in the International Energy Agency (IEA) agreed to release 60 million barrels of oil from their emergency stockpiles, thereby increasing supply as sanction influenced shortfalls grow.
- The White House has also proposed suspending the federal gas tax until 2023, a move that would save drivers 18.4 cents per gallon. The gas tax is one of the main revenue sources for the federal highway trust fund, and a suspension from March through December is likely to reduce trust fund revenue by $20 billion, almost half its annual budget.
- States such as Florida and Illinois have also proposed cutting state gas taxes. The US Energy Information Administration (EIA) reported that combined federal and state taxes accounted for 16% of average gas prices between 2010 and 2020. Opponents of the gas tax waivers argue that motorists will only save marginal amounts, while critically needed infrastructure funds would be compromised. Although highway funds are likely to be replenished by deficit financing, we anticipate impact on future state and local initiatives funded by gas tax revenues.
Implications for Energy Dependent States
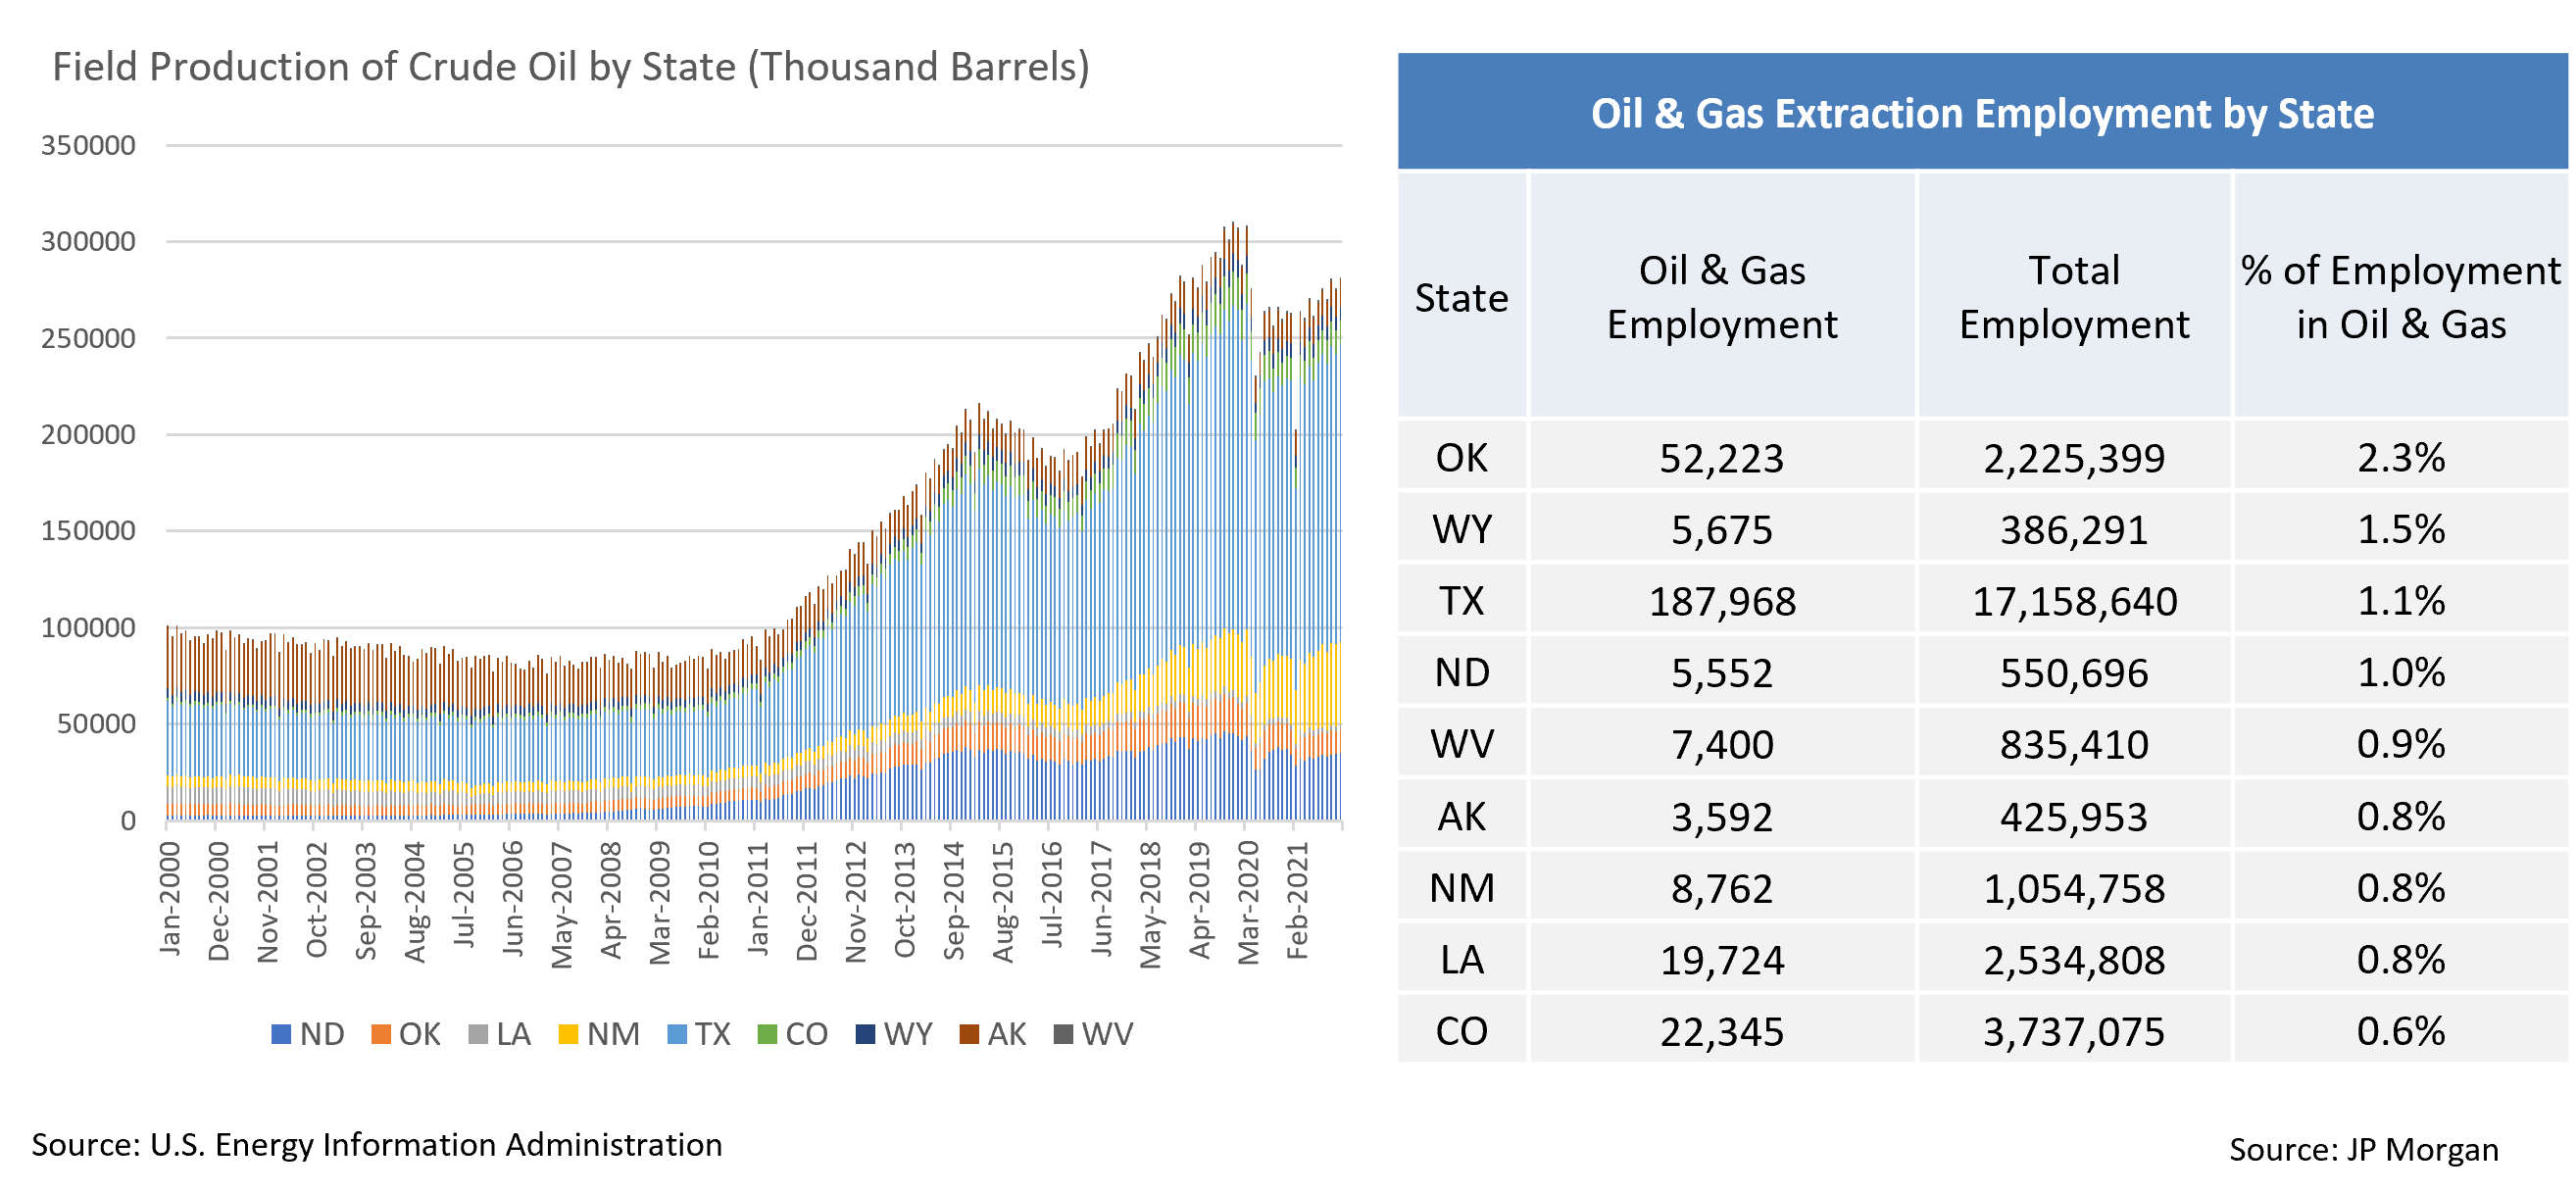
- Rising prices will benefit energy producing states and localities given their revenue and employment concentration. Oil prices are also positively correlated with production levels and severance taxes.
- The nine states referenced below have particularly high energy production and employment exposure. Most states derive severance taxes based on output volume rather than value, a methodology that allows for more predictable returns and less volatility.
- Severance taxes should bolster state budgets in coming years as companies ramp up production to take advantage of high oil prices. The political environment is also reassuring with US energy production expected to accelerate in the face of supply concerns and Russian sanctions. Furthermore, tapping into strategic reserves will require replenishing this stockpile, adding to our expectations for robust production trends.
- As these scenarios play out, severance taxes should contribute to sustained economic growth in oil dependent states. This comes after state budgets were already fortified by pandemic related federal aid, a trend that reinforces positive credit conditions.

Strategy Overview
Composite Portfolio Positioning as of 2/28/22

Duration Exposure by Strategy as of 2/28/22

Our Philosophy and Process
- Our objective is to preserve and grow your clients’ capital in a tax efficient manner.
- Dynamic active management and an emphasis on liquidity affords us the flexibility to react to changes in the credit, interest rate and yield curve environments.
- Dissecting the yield curve to target maturity exposure can help us capture value and capitalize on market inefficiencies as rate cycles change.
- Customized separate accounts are structured to meet your clients’ evolving tax, liquidity, risk tolerance and other unique needs.
- Intense credit research is applied within the liquid, high investment grade universe.
- Extensive fundamental, technical and economic analysis is utilized in making investment decisions.


