Insights and Observations
Economic, Public Policy, and Fed Developments
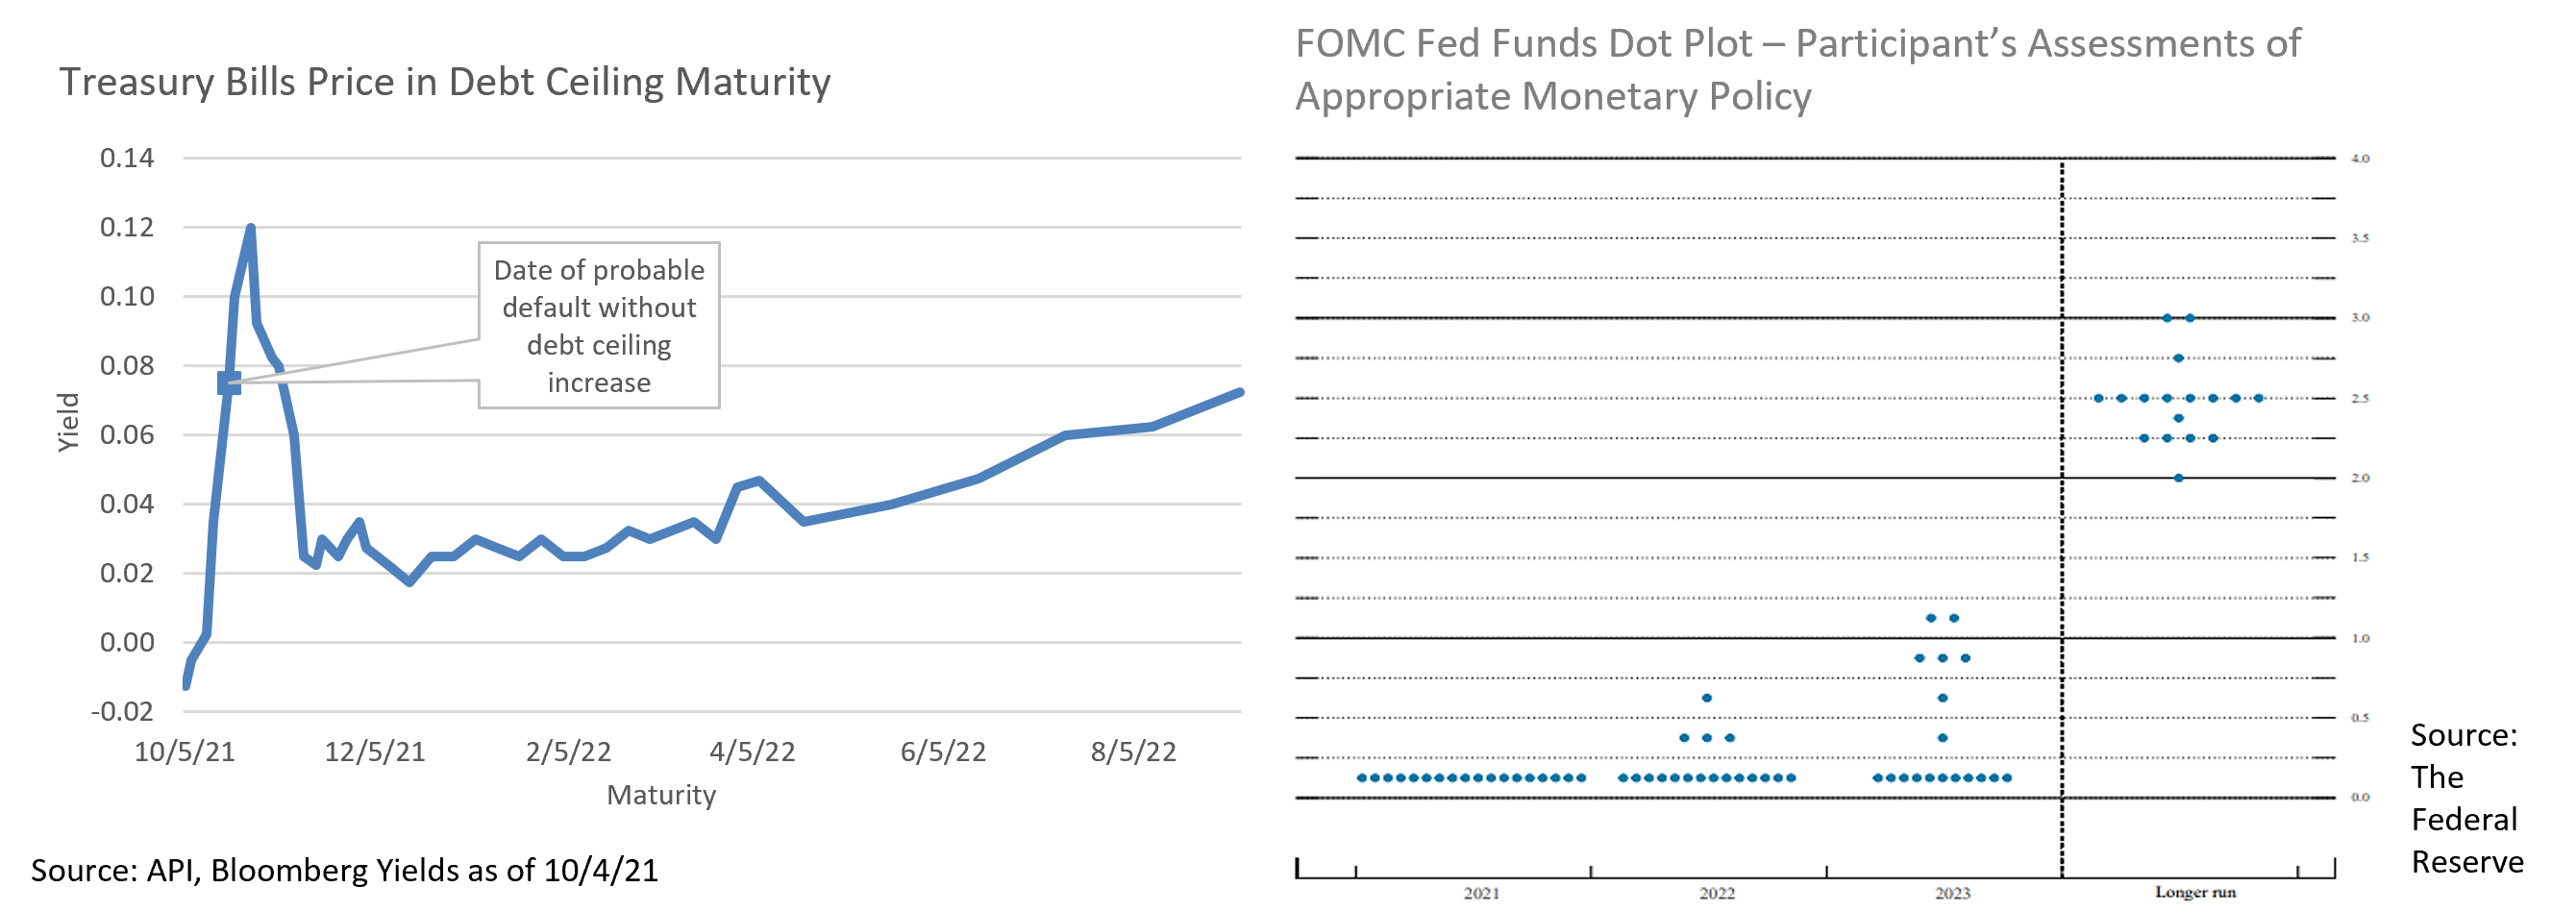
- A potential October surprise was averted in late September when Congress passed a continuing resolution funding the government through December, but legislative hurdles remain on the horizon. Secretary Yellen estimates the debt ceiling will be breeched on 10/18, risking sovereign default in the absence of Congressional action. Republicans have thus far blocked Democratic efforts to raise the limit, expecting them to instead reopen their reconciliation infrastructure bill to add a debt ceiling increase. Short-term yields around the expected drop-dead date have already cheapened relative to maturities before and after, reflecting growing political uncertainty.
- Finding a workable compromise for the reconciliation infrastructure bill has proved quite challenging. Senate moderates have balked at the price tag of the $3.5T “Build Back Better Act” House progressives have tied to the Senate’s bipartisan “hard” infrastructure bill and are pushing for a smaller package. Meanwhile, the progressive caucus is refusing to support the bipartisan bill unless the Senate passes their own bill via budgetary reconciliation. With Democrats holding extremely narrow margins in Congress, the fate of both bills and their impact on the markets is highly uncertain.
- Debate over whether the Fed was right to expect “transient” inflation in 2021 is becoming less relevant, as it was predicated on a reopening economy with COVID behind us. Instead, Delta continues to depress demand at home and supply abroad. US retail sales did surprise in September, but with evidence of a “substitution” effect with consumers foregoing services for goods. Similar patterns were also evident in a CPI miss that saw reopening-sensitive sectors such as transportation and hotel accommodations account for much of the shortfall. While PPI ex-food, energy, and trade, a popular “core” purchasing manager inflation metric, rose by the least amount since November, the headline number still exceeded expectations and survey respondents reported continued supply chain pressures. Purchasing managers indicated they expect to pass on costs, so there is a good chance PPI will flow into lingering consumer inflation as COVID continues to disrupt the global economy.
- Labor supply is confounding markets as well. While the ISM Manufacturing report employment index rose modestly from 49.0 to 50.2, this is barely out of contraction range and companies are still struggling to attract workers. Evidence that enhanced pandemic unemployment benefits were encouraging workers to stay home has weakened. Bloomberg interviews with staffing firms suggest that no rush of new job seekers materialized after these programs ended. At present, there is no consensus on why the workforce is failing to return to pre-pandemic levels, although BLS survey data suggests pandemic related concerns are at least partially to blame.
- September was an interesting month for Fed watchers. First, Chairman Powell emphasized that the Fed is on track to begin tapering, indicating that an announcement could come “as soon as next meeting” on 11/2. Consensus estimates are that tapering will begin in December in the range of $15B a month. Meanwhile, the Fed Funds median dot plot projection has now risen to 1% by the end of 2023 suggesting 2 or 3 hikes by that time. It is important to note though that dispersion is high with no clear consensus – the Fed expects to raise rates by the end of 2023 but lacks agreement on how far.
- A second development may also impact the dot plot; Fed presidents Eric Rosengren (Boston) and Robert Kaplan (Dallas) stepped down at the end of September. Rosengren cited health concerns, although both men had been criticized for aggressive stock trading during the period the Fed was preparing its pandemic fiscal support. Both were staunch hawks, and Rosengren was due to take a voting seat on the FOMC in 2022, so their departures could potentially lower the dot plot median and may produce a more dovish FOMC.

From the Trading Desk
Municipal Markets
- The municipal market continues to be supported by robust retail demand. Over the last 72 weeks, 71 have produced net mutual fund inflows, the sum of which exceeds $150 billion. This sustained demand has been coupled with modest issuance, most recently evidenced by a 33% reduction in new supply in September versus the same month of 2020. Although YTD issuance is just 2.4% lower than the same period of 2020, buyers are still facing a tight market characterized by somewhat limited primary and secondary market bond availability.
- Taxable municipal supply remains a factor in restraining the overall tax-exempt supply picture. Over the course of 2021, taxable issuance has accounted for about 24% of total new supply, down somewhat from an elevated 30% in 2020. While the percentage is slightly lower this year than last, it remains high by historical standards and has effectively reduced the buying universe for tax-exempt debt.
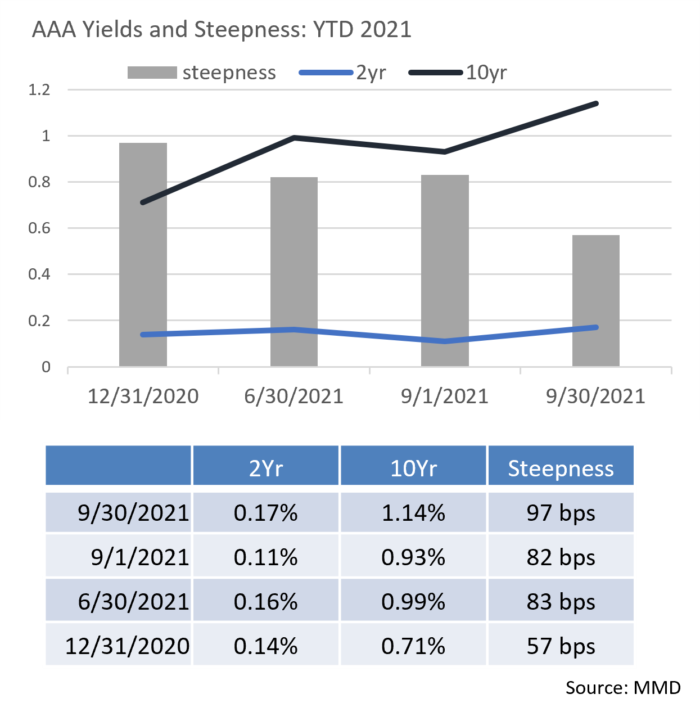
- The yield curve, taking cues from taxables, rose over the month giving traders an opportunity to take advantage of slightly higher rates. The 10Yr AAA municipal yield rose to 1.14% at the end of the month, up from 0.93% at the start. The 2 to 10-year municipal curve also steepened to 97bps from 82bps, which makes extending from shorter bonds into the 10-year range more attractive.
Corporate Bond Markets
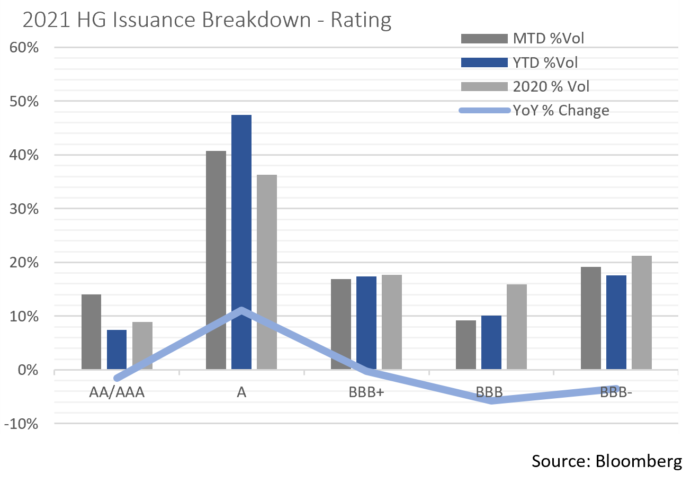
- The pace of 2021 Investment Grade issuance has been slightly heavier than the historical average as borrowers have moved to capitalize on a favorable environment. The $158.19 billion of new Investment Grade debt issued in September brings the YTD total to $1,121.49 billion. That is roughly on pace with the record $1,542 billion set in 2020 and is already 21% ahead of 2019 ($923.6 billion). BBB-rated names represented roughly 45% of last month’s new deals, while higher rated names rounded out the balance. The increase in higher rated bonds coming to market is noticeable as the Finance and Technology sectors have actively returned to the debt markets for refinancing purposes. Barring unforeseen rate shifts or changes in risk appetite, we expect issuance to moderate over the balance of 2021, a development that would be positive for spreads.
- Relative stability of macro factors, favorable market technicals, and strong credit fundamentals continue to create a strong foundation for IG credit. After hitting a YTD low of 80 OAS on the Bloomberg Barclays US Corporate Index in June, spreads have traded in a very tight band and nearly breached that low on 9/27 with an 82 OAS close. In our view, the factors most likely to put pressure on spreads lie in the potential for debt ceiling disruption and/or sustained inflation. These, more so than a reduction in Fed asset purchasing, are what concerns us as we enter Q4. Nonetheless, we still expect a continuation of credit spread resiliency through the remainder of the year.
- The Federal Reserve’s slight tone shift in this past month’s FOMC meeting drove UST yields higher, producing intermediate curve steepening. Spreads between the 2Yr and 10Yr hit 120 bps, as compared to a 10Yr to 30Yr differential of only 56 bps, just 5 bps off the year’s low. Most of the Fed rate response occurred in the intermediate portion of the curve with 5, 7, and 10Yr maturities higher by 19 to 21 bps. The 10Yr UST closed Q3 at 1.49% and the long bond was higher by 13 bps at 2.05%. While we remain cautious about duration, the intermediate part of the curve is providing opportunities to add incremental yield.
Public Sector Watch
Credit Comments
Recent Impacts from the Delta Variant:
- The March 2020 onset of the COVID-19 pandemic created widespread economic shutdowns, impacting nearly every aspect of the municipal market. Nineteen months later, sector performance and credit conditions have diverged considerably.
- The Port Authority of New York and New Jersey recently posted three headlines that collectively emphasize how differently sectors are being affected: “Airport Passenger Volume Down 38 Percent from August 2019”; “Bridge and Tunnel Traffic Close to Pre-Pandemic Volumes”; and “Seaport Achieves 13th Consecutive Month of Record Cargo Volumes.”
Airports:
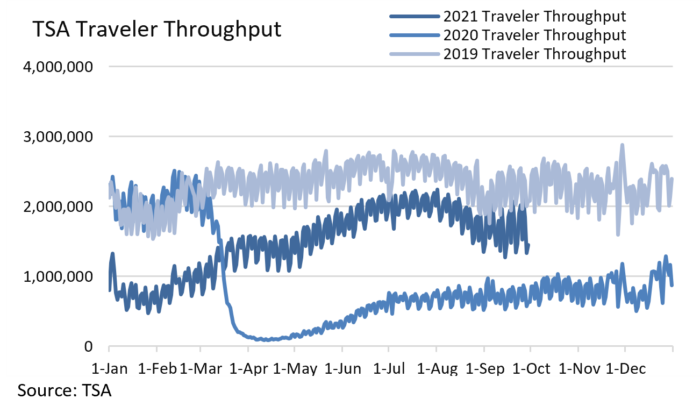
- Despite a promising summer that saw the TSA report the highest throughput volumes since the start of the pandemic, the airline industry appears to be heading into another slump. Many airlines cut flights from their Fall schedules as bookings declined considerably in late summer.
- The expectation that airlines would post Q3 profits due to a rebound in leisure and business travel quickly stalled as companies delayed returns to the office and consumer COVID-19 concerns rose along with mounting case counts. Major airlines are now anticipating lower-than-expected revenue while others are grappling with losses.
Toll Roads:
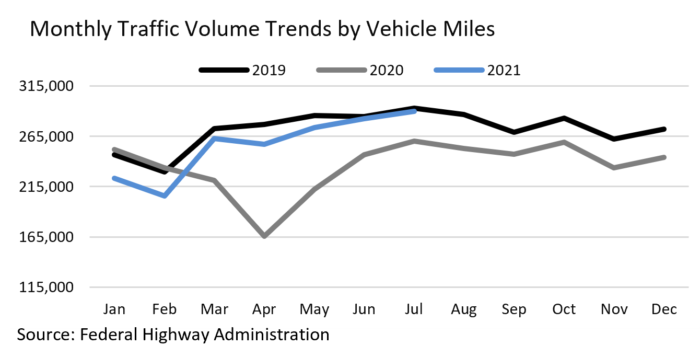
- By contrast, ground travel is robust with many non-profit toll roads reporting traffic volume at 90-100% of 2019 levels.
- The Federal Highway Administration recently reported that total vehicle miles traveled on U.S. public roads in July was down less than 1% from 2019 and that YTD traffic volume only trails 2019 by 4.9%.
- The toll road sector has proven to be resilient throughout the pandemic and has been characterized by ample cash reserves and a demonstrated ability to raise rates to maintain strong debt coverage. Notably, none of the 55 toll road operators rated by S&P were downgraded in 2020 or 2021.
Ports:
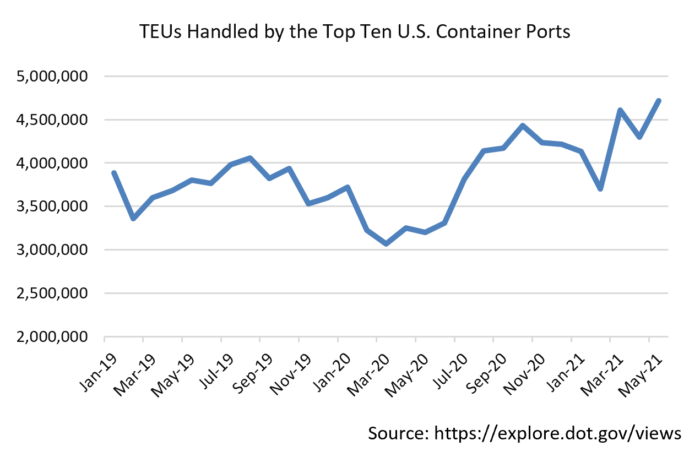
- U.S. ports are experiencing significant increases in volume as the economic recovery proceeds. A key indicator lies in a combined 41% increase at the Long Beach and Los Angeles ports over the first six months of 2021 vs. the prior year. Over this same period, the Port Authority of New York and New Jersey, the largest port on the East Coast, posted a 30% YoY increase. Globally, the twenty largest ports have experienced a more modest 13% increase, revealing the disproportionate strength of the U.S. recovery.
- Despite increasing volume and its positive credit implications for bond issuers, ports have been challenged by worker shortages as the peak shipping season begins. Tens of thousands of containers are stuck at Long Beach and Los Angeles with waiting times stretching to three weeks. In response, ports have been quick to implement changes, with Long Beach adopting 24-hour gate operations and Los Angeles taking proactive measures to boost efficiency.
From a credit perspective, macro trends are growing in importance as bond issuers grapple with a highly unusual environment. This speaks to the importance of diligently assessing macroeconomic and related conditions, and this analysis is an important input into our assessment of individual credits and their ability to respond to current challenges.
Strategy Overview
Composite Portfolio Positioning as of 9/30/21

Duration Exposure by Strategy as of 9/30/21

Our Philosophy and Process
- Our objective is to preserve and grow your clients’ capital in a tax efficient manner.
- Dynamic active management and an emphasis on liquidity affords us the flexibility to react to changes in the credit, interest rate and yield curve environments.
- Dissecting the yield curve to target maturity exposure can help us capture value and capitalize on market inefficiencies as rate cycles change.
- Customized separate accounts are structured to meet your clients’ evolving tax, liquidity, risk tolerance and other unique needs.
- Intense credit research is applied within the liquid, high investment grade universe.
- Extensive fundamental, technical and economic analysis is utilized in making investment decisions.


