


Insights and Observations
Economic, Public Policy, and Fed Developments
- October proved to be volatile in the Treasury markets, with the 10Yr spiking early in the month after steady, gradual increases in September. Yields peaked at an October 5th closing high of 3.23% before retracing to 3.08% at month end, only 3bps higher than September’s close. The market initially reacted to Fed Chairman Powell’s observation that short term rates were “nowhere close to normal.” However, the timing of the move also aligns closely with the expiration of a tax break for corporations buying bonds to fund pensions, implementation of $200B in additional Chinese tariffs, and the Fed’s increasing its monthly balance sheet runoff a further $10B to $50B. The move spooked equity markets; while they recovered somewhat in the final days of the month, October proved to be the S&P 500’s worst month since 2011, briefly dipping into correction territory.
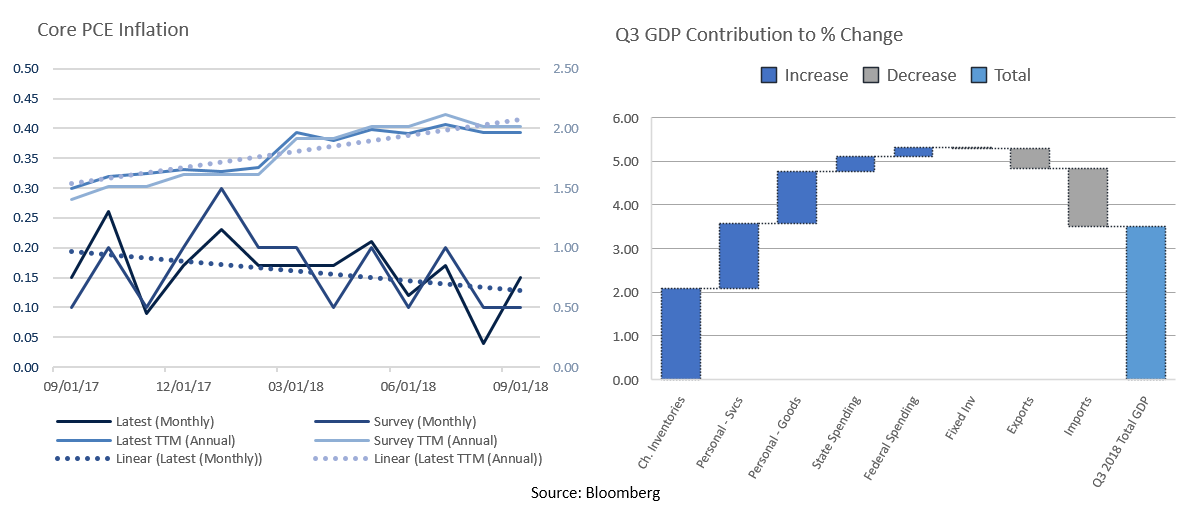
- While the annual inflation rate remains at or near Fed targets, monthly observations continue to weaken. CPI missed expectations in September, and while PPI returned to a monthly 0.2% pace after a flat reading in August, this wasn’t enough to stop the annual headline reading from dropping two tenths of a point. Meanwhile, Core PCE inflation, the Fed’s preferred measure, technically beat the consensus forecast of 0.1%, but taken out to an additional decimal place the reported 0.2% was only actually 0.15%. While the trailing 12-month inflation number gradually strengthened to the Fed’s 2% target in 2018, we note a recent decelerating trend in monthly readings. To remain at an annual rate of 2.0%, Core PCE will need to come in at 0.29% or higher in November, which would be the highest reading since January 2012. A miss in the annual rate could slow the pace of Fed rate hikes.
- As expected, GDP growth cooled in Q3, but at 3.5% it still slightly exceeded market expectations and came in at the very top of our anticipated range. Evidence of strong consumer spending and the need to replenish depleted inventories we had noted in previous commentaries was confirmed through a 4.0% acceleration in consumption and a 2.1% contribution to GDP from change in inventories. The previously discussed inflation slowdown was also evident, with the PCE deflator dropping to 1.6%, headline and core. Trade, meanwhile, was a strong detractor, taking nearly 1.8% from GDP, the largest negative impact in 33 years, as tariffs began to show their teeth.
- As America goes to the polls on Tuesday, November 6th, the Democrats are widely expected to regain control of the House, while the Republicans are expected to maintain or expand their hold on the Senate. Election forecaster FiveThirtyEight projects the Democrats have a roughly 7-in-8 chance of winning the House, while the Republicans have a 4-in-5 chance of winning the Senate, though they note an upset in either chamber is roughly as likely as any random day of the week being Tuesday and should not be ruled out. Over the long term, political gridlock will likely be detrimental, particularly with an annual budget deficit approaching $1 trillion, but in the short run a deadlocked Congress may be positive for the economy as it takes some political risk off the table.
From the Trading Desk
Municipal Markets
- Yields on the municipal curve moved higher during October, although slightly outperforming Treasuries, with the 10Yr ending at 2.70%. Upward pressure on longer maturities resulted in modest steepening, as the 2-10 Yr spread now stands at 65 bps, up from 61 bps at the end of Q3.
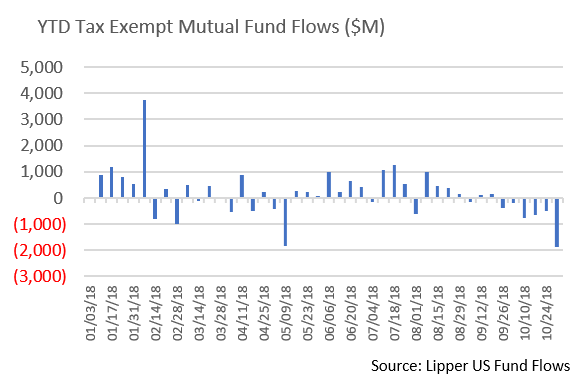
- Municipal mutual funds have experienced significant outflows over the past 6 weeks in the face of interest rate pressures and Fed speculation, bringing YTD net flows down to $6.9 billion from August’s high of $11.2 billion. However, this may not persist longer term as higher yields create more attractive income streams. We may also see increased foreign investment in munis, specifically originating from countries still experiencing very low sovereign debt yields. Foreign investors are attracted to the muni asset class for yield, diversification and low historical default rates. While these investors generally prefer taxable munis, tax-exempts are a viable alternative when the supply of taxable issues is limited.
- YTD issuance of $288.1 billion through the end of October is down 13.6% compared to the same period of 2017. And supply is expected to remain constrained, with 30-day visible sitting at just $5.6 billion as we approach shortened trading weeks due to the Midterm elections, Veterans Day and Thanksgiving. Tax loss harvesting accounts for a greater percentage of trading volume as year-end draws closer. While this environment creates trading challenges, we continue to look for opportunities to optimally position client portfolios.
Taxable Markets
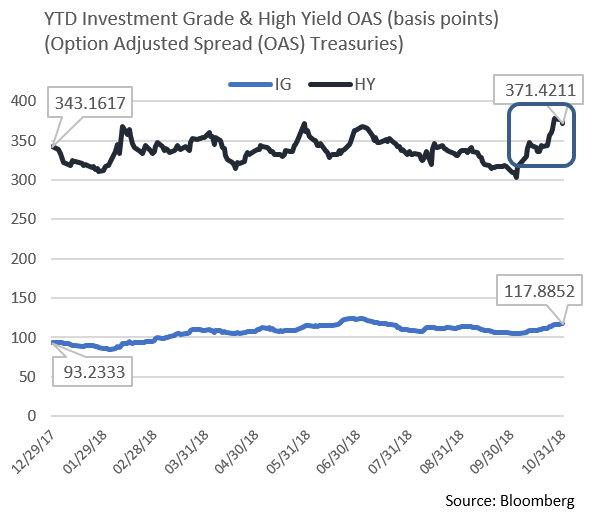
- October began on solid footing, and Investment Grade credit spreads held tight as the market strengthened to levels that had not been touched since April of this year. On October 2nd, Comcast brought the second largest deal of the year and the fourth largest deal in IG history. Comcast’s $27 billion offering, which was slated to fund its Sky PLC acquisition, was well received and priced higher than initially thought. The relatively easy digestion of the deal was no surprise given strong demand and appetite for yield at the time. This too was the case for High Yield credit, as spreads in that market had not been as rich since July of 2007. A strong appetite for yield, a willingness to stretch for lower quality to obtain it, along with minimal new supply, contributed to solid high yield returns over the first 10 months of the year.
- This strong footing rapidly changed, becoming much more unstable as a “risk-off” sentiment began to materialize. Stock market volatility, heightened global macro risks, and a flight to safety characterized the last seven trading days, resulting in the worst performing October since the dismal days of 2008. As we have long emphasized, a flight to quality can happen very quickly, and the lower the credit quality the more rapidly this tends to occur. As the accompanying chart reveals, it took just 19 trading days to go from the low to high in High Yield spreads for the year, and the 22% change in spreads caught many investors off guard. However, the change in Investment Grade spreads was much more subdued. This recent shift highlights our preference for high quality investment grade credit, as we believe remaining “up in quality” is prudent, particularly as investors navigate global uncertainty, volatility, and rate shifts.
Public Sector Watch
Credit Comments
A recent article in the WSJ resurrected the well chronicled 2010 claim by a bank analyst that the municipal market would experience “hundreds of billions of dollars of defaults.” The Journal emphasized that the dramatic call was not incorrect, just early, and that municipal bond investors “should heed warning.” We disagree and believe the municipal market continues to offer investors a relatively safe and stable haven within a diversified portfolio, particularly when backed by professional research and portfolio management. And while pockets of stress are certainly evident, and risk factors such as pension funding are of concern, in our opinion, overall municipal credit remains strong. Our view is supported by several important metrics. Prolonged recovery has created consistent revenue growth
- State and local tax revenues grew in 32 of 35 quarters from Q3 2009 through Q2 2018, reflecting a prolonged, economic recovery.
Reserves have been rebuilt
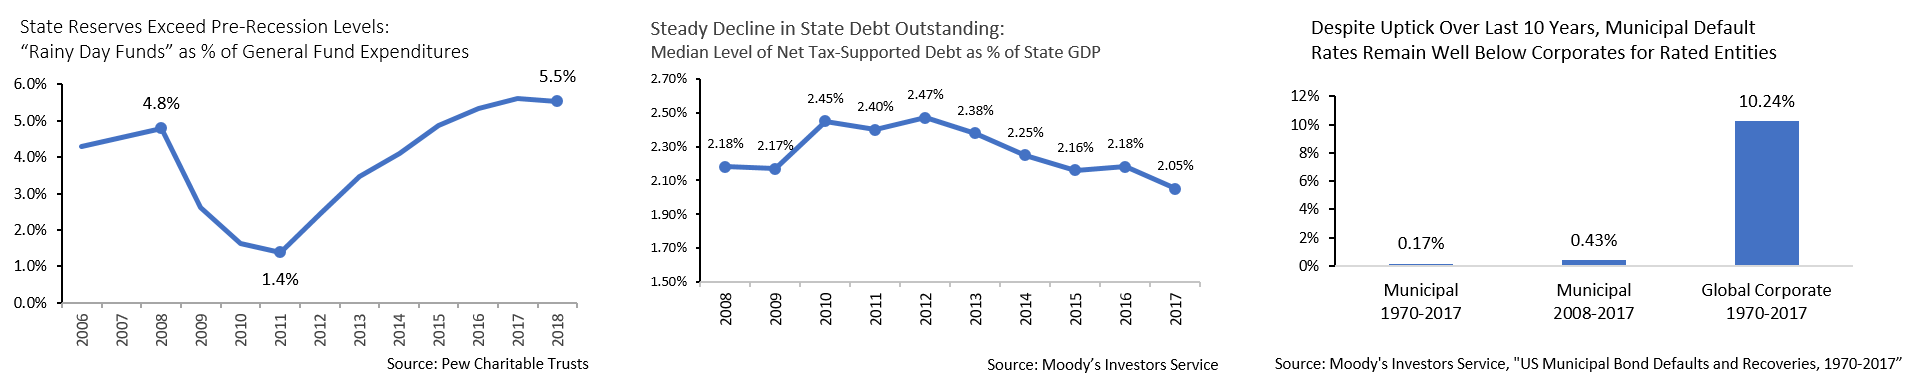
- Many states have capitalized on better times to prudently rebuild their reserves. According to Pew Charitable Trusts, states’ “Rainy Day Funds” reached 5.5% of expenditures in fiscal 2018, versus a pre-recession peak of 4.6%.
Debt burdens have been reduced
- Deleveraging and reluctance to expand balance sheets has been evident, as increased tax revenue has facilitated a reduction in debt burdens. Median state debt as a percentage of GDP is now 2.05%, below the pre-recession peak of 2.18%.
Municipal distress remains rare
- The municipal market is not immune from credit crisis, and defaults such as those of Detroit and Puerto Rico are understandably highly publicized. Nonetheless, cumulative defaults are rare and far below the rate experienced in the corporate markets.
Strategy Overview
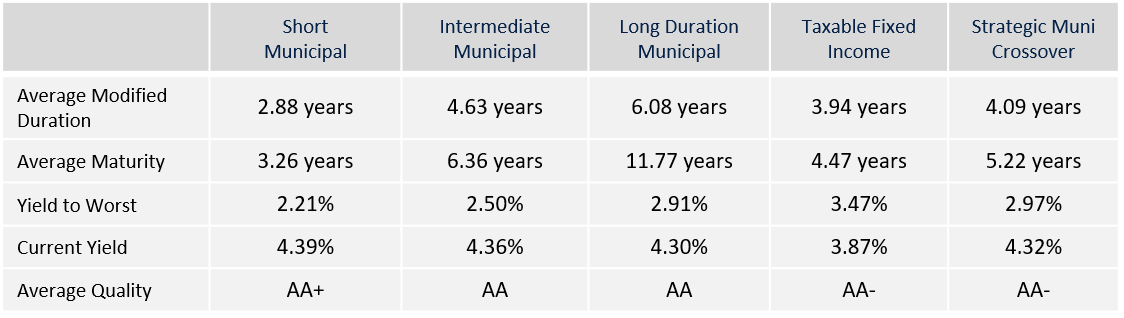
Portfolio Positioning as of 10/31/2018
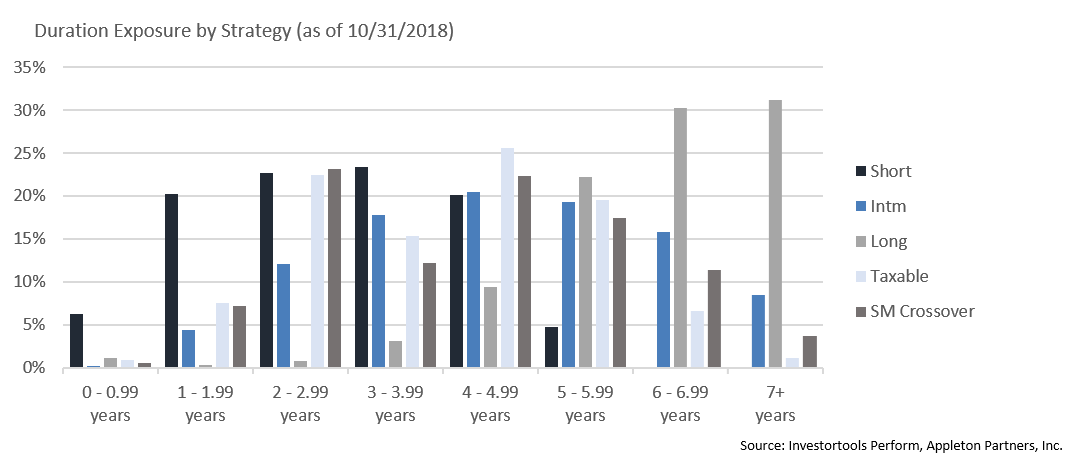
Duration Exposure by Strategy as of 10/31/2018
Our Philosophy and Process
- Our objective is to preserve and grow your clients’ capital in a tax efficient manner.
- Dynamic active management and an emphasis on liquidity affords us the flexibility to react to changes in the credit, interest rate and yield curve environments.
- Dissecting the yield curve to target maturity exposure can help us capture value and capitalize on market inefficiencies as rate cycles change.
- Customized separate accounts are structured to meet your clients’ evolving tax, liquidity, risk tolerance and other unique needs.
- Intense credit research is applied within the liquid, high investment grade universe.
- Extensive fundamental, technical and economic analysis is utilized in making investment decisions.