


Insights and Observations
Economic, Public Policy, and Fed Developments
- As we write, Congressional negotiations on a second stimulus deal continue, after the House passed a $3T package in May and the Senate unveiled a $1T counterproposal at the end of July. Large issues remain to be bridged – the Republican plan contained no aid for cities and states and reduced weekly Federal unemployment benefits from $600 to $200, for example – however, we are optimistic that a new stimulus deal will be forthcoming. In an election year both parties recognize that more fiscal stimulus is required, and President Trump is eager to sign something. Time is of the essence, as badly needed weekly Federal unemployment benefits have now lapsed. Negotiations may favor the Democratic approach, which includes considerable municipal aid, as the Senate has not yet voted on the Republican plan and it is unclear if it has the votes to pass without Democratic support.
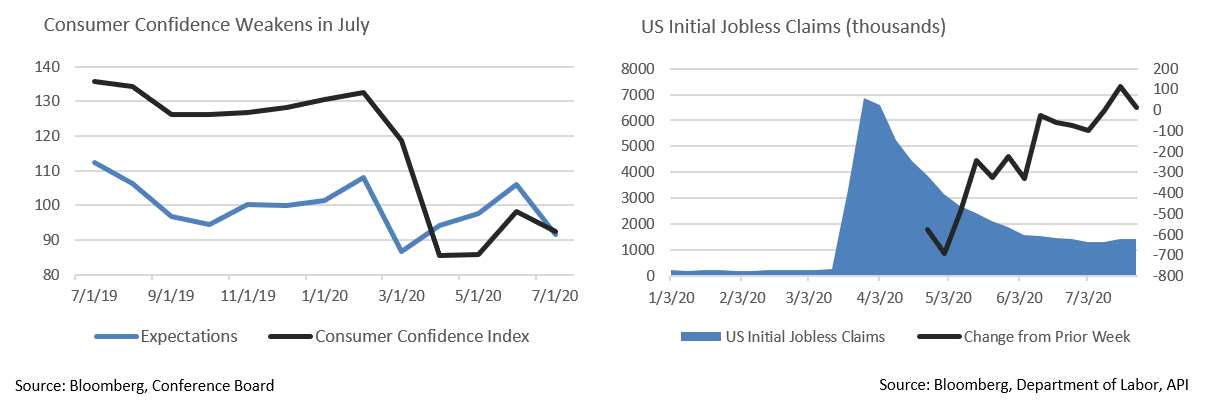
- After several weeks of strengthening, the labor market is showing cracks; the 7/23 weekly jobs report missed expectations, with new unemployment claims of 1.42M exceeding a flat consensus expectation of 1.3M. This was the first increase in new claims since the lockdown-related massive spike in March, as a worsening pandemic in large sections of the country caused several states to begin rolling back re-openings.
- This deterioration was echoed in July’s consumer confidence readings; the headline reading slid to 92.6 vs. expectations of 95.0. Conditions at the time the survey ended on 7/17 were still relatively strong and much of the disconcerting weakness began to be revealed later in the month. Forward expectations dropped from 106.1 to 91.5 Much of the decline was concentrated in states such as California and Florida where Coronavirus cases were surging, whereas New York showed improvement amid far more successful control of the virus. We expect consumer confidence to weaken further in August should the pandemic worsen and feel economic growth will remain tied to our ability to contain the Coronavirus pandemic.
- After a five-month delay, the nominations of Judy Shelton and Christopher Waller to the Fed Board of Governors cleared the Senate Banking Committee on 7/22 on a party line vote. Waller’s nomination wasn’t controversial, but Shelton, a former gold bug whose policy stances changed dramatically upon joining the Trump campaign as an advisor, is an extremely controversial and politically divisive pick. Her nomination is expected to meet with some resistance, although she is likely to be confirmed. Should this be the case, the market’s response bears monitoring, as her confirmation would further jeopardize the Federal Reserve’s perceived independence at a time when their role in the economy is arguably greater than ever before.
- Fed Chairman Jerome Powell used part of his testimony in July’s FOMC meeting to stress that, despite unprecedented federal stimulus and deficit spending, he remains far more concerned about deflation than inflation. The recession was driven by a demand shock rather than a supply shock, as daily life was abruptly shut down to halt the spread of Coronavirus. Stimulus efforts have been focused on keeping companies out of bankruptcy and individuals employed, or put another way, preserving supply capacity despite a collapse in demand. Supply is likely to continue to exceed demand for the foreseeable future, particularly in sectors dependent on large-scale public consumption, a dynamic that should keep a lid on inflation for some time. While the US government is engaged in unprecedented levels of stimulus spending, we support Chairman Powell’s approach.
- The second quarter GDP report was historically bad; the best that can be said is that the 32.9% annualized decline was closely in line with expectations. On a quarterly basis, the 9.5% fall puts the US somewhat ahead of the Eurozone, where GDP contracted an even more severe 12.1%. Regardless, a decline in US economic activity of nearly 10% in 3 months is sobering and reflects the sudden shock incurred as a result of Q2 lockdowns.

From the Trading Desk
Municipal Markets
- The municipal curve reflects historically low yields, a condition that will likely persist. Technical conditions remain very strong and there is significant support for the asset class. Mutual fund flows have been positive for the past 11 consecutive weeks, raising YTD net inflows to $3.1B despite $47B of pandemic induced net outflows in the Spring. Intermediate maturity strategies have led the way with $1.5B in net inflows.
- Sustained demand for municipals is anticipated in August as $36B of upcoming coupons and maturities are likely to far exceed expected new supply, leaving investors with considerable cash to reinvest in the tax-exempt markets.
- Yield is at a premium across the global fixed income marketplace. On a relative basis, municipals still appear attractive with the 10Yr AAA municipal/UST ratio ending July at 118%. However, with the 10Yr UST at 0.55%, small changes in yield levels can significantly alter ratios, thereby increasing the volatility of the often-referenced AAA municipal/UST ratio.
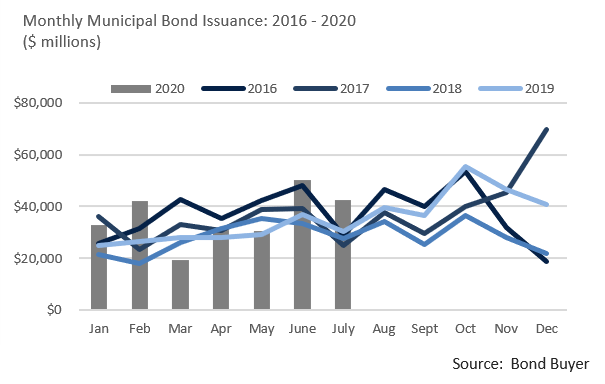
- Although July municipal supply of $42.6B came in 40% higher than the same month of last year, 35% of that issuance was taxable. As a result, tax-exempt investors still face relatively tight primary market bond availability, a factor that has helped tightly constrain yields. Bond Buyer 30-day visible supply is about $14.5B, slightly higher than the average for the year.
Corporate Bond Markets
- Investment grade corporate bond issuance slowed considerably this past month as only $63.45B of new debt hit the market. It was the slowest month since February’s $89.3B and well below the 2020 monthly average of $175B. Companies have reduced their pace of borrowing as cash raised thus far has fortified balance sheets and appears to sufficiently address perceived liquidity needs. Demand for high grade corporates has easily absorbed earlier levels of high issuance, and with net supply waning of late, technical factors should remain favorable.
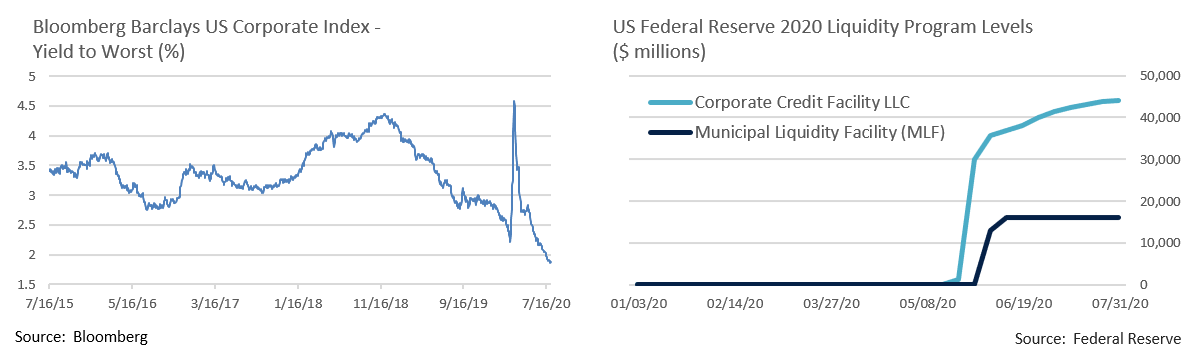
- After spiking to 4.58% on 3/20, the Bloomberg Barclays US Credit Index YTW dropped below 2% on 7/17 for the first time ever. A combination of ultra-low UST rates and tightening credit spreads have driven yields to record lows.
- Corporate bonds are not the only asset class posting record low rates. The UST 5Yr note touched 0.26% on 7/28 before grinding lower to close the month at 0.20%. By comparison, the benchmark note began the year at 1.71%. The Fed continues to grapple with a suppressed yield environment and a highly uncertain economic outlook. At this stage we do not anticipate negative yields, although some have broached the possibility.
- The Federal Reserve’s Primary Dealer and Corporate Credit Facilities, although barely used, have sustained corporate bond risk appetite. These and other programs helped stabilize turbulent markets back in March and their continued existence is reassuring to investors. Assets deployed dropped considerably during Q2 and into Q3, a promising sign.
Public Sector Watch
Credit Comments
Defaults Tick Up but Remain in “Risky” Sectors
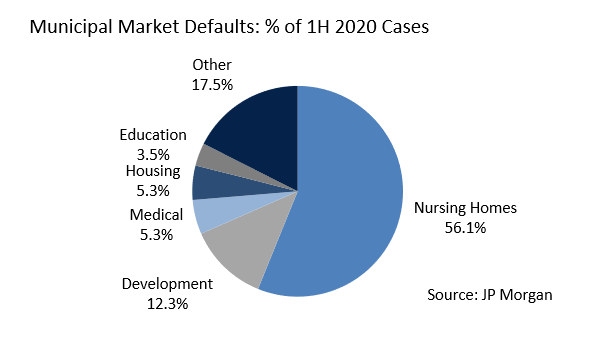
- COVID-19 has impacted all corners of the economy, municipalities being no exception. However, the effects have not been uniform and pockets of the municipal market seen as “risky” prior to COVID-19 are not surprisingly the ones experiencing the most acute challenges.
- There have been 56 municipal market defaults during the first half of 2020, already higher than annual totals for 8 of the past 10 years. The majority occurred in healthcare and senior living, housing, and start-up project development, with the nursing home sector alone accounting for more than half of all defaults.
- Appleton does not have exposure to these sectors as they fall outside of our longstanding preferences for issuers with diversified, sustainable revenues and more secure asset bases.
- While we expect the municipal default rate to remain elevated compared to historical levels, it should stay low relative to the size of the overall market. JP Morgan estimates that the default rate could tick up to 0.46% to 0.60% over the next few years. This compares to an annual average of 0.16% since 1970. While these modest default rates broadly reflect the credit strength of the asset class, we believe that fundamentally driven security selection remains critical. Our investment process emphasizes larger issuers with robust balance sheets and budgetary flexibility.
Will Congressional Aid Help Cover State and Local Revenue Losses?
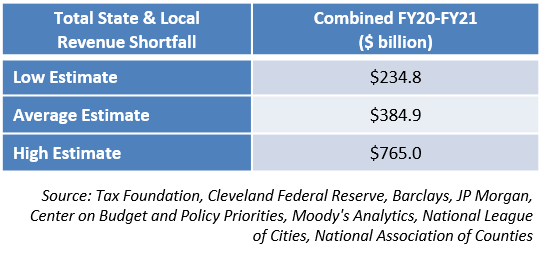
- Congressional negotiations concerning the next phase of stimulus support are ongoing and divergent proposals from the House ($1 Trillion) and Senate (none) reflect stark differences relative to additional aid for state and local governments. Politics aside, how much Federal aid might municipalities need given potential revenue shortfalls?
- State and local revenue projections through FY 2021 vary widely, reflecting extreme uncertainty concerning the longevity and depth of the economic crisis. Aggregating these projections gives us average, low, and high estimates of total revenue shortfalls, the impact of which is very real.
- Most state and local governments entered 2020 in a position of fiscal strength and possess a range of management tools to help weather current conditions. If no additional aid is provided to municipalities deeper budget cuts will be necessary, creating a headwind for the nation’s economy.
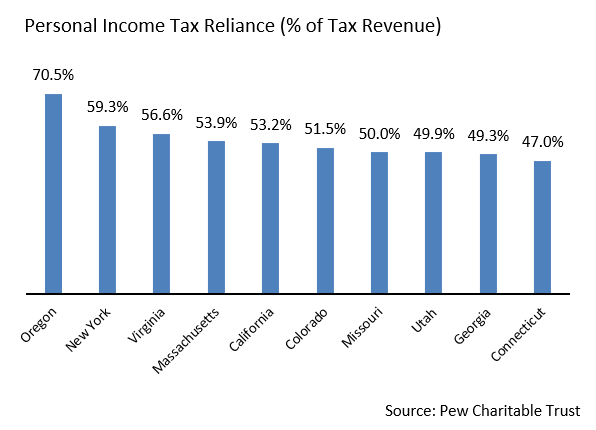
Deferred Tax Revenues May Boost State Liquidity
- With 41 states having delayed income tax filing and payment deadlines from April 15th to July 15th, last month’s tax collections take on heightened importance. The Urban Institute estimates that 13% to 15% of annual income tax revenues are collected in April.
- Although July income tax revenue data remains scarce, the State of California provides a weekly update on collections, data we view as a rough proxy for other states that levy income taxes. The Legislative Analyst Office indicates that from April through July 17th cumulative income taxes were down $2B vs. the same period of 2019, or 9% YoY. California’s July tax revenue was impressive, and collection of deferred taxes closed much of what had been a $26B revenue gap vs. the prior year incurred from April through June.
- While states continue to struggle with COVID-19 related revenue shortfalls, strong July tax collections should provide much needed liquidity for those states that levy an income tax.
Strategy Overview
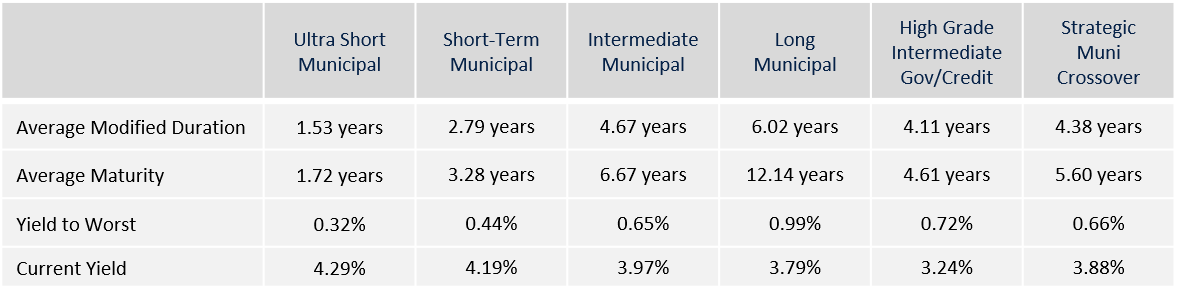
Portfolio Positioning as of 7/31/20
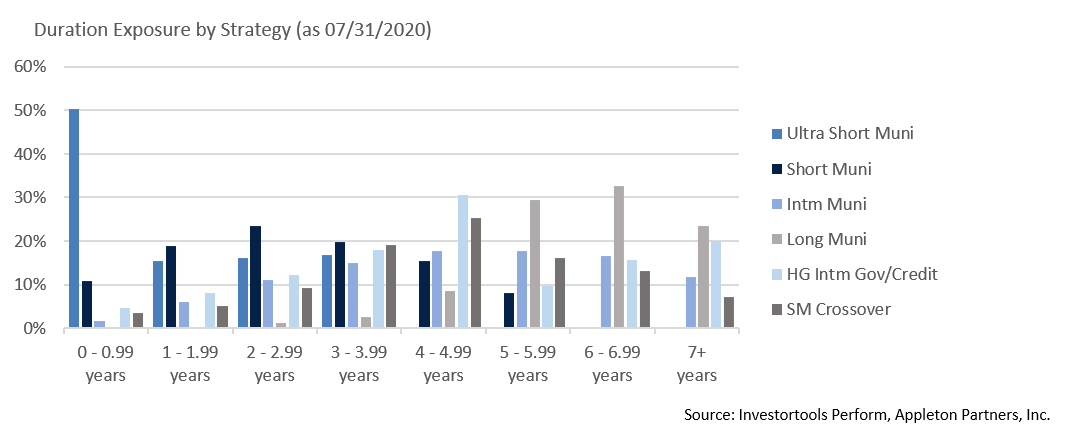
Duration Exposure by Strategy as of 7/31/20
Our Philosophy and Process
- Our objective is to preserve and grow your clients’ capital in a tax efficient manner.
- Dynamic active management and an emphasis on liquidity affords us the flexibility to react to changes in the credit, interest rate and yield curve environments.
- Dissecting the yield curve to target maturity exposure can help us capture value and capitalize on market inefficiencies as rate cycles change.
- Customized separate accounts are structured to meet your clients’ evolving tax, liquidity, risk tolerance and other unique needs.
- Intense credit research is applied within the liquid, high investment grade universe.
- Extensive fundamental, technical and economic analysis is utilized in making investment decisions.