


Insights & Observations
Economic, Public Policy, and Fed Developments
- After a spring marked by volatile economic data and a first half of 2024 plagued by uncertainty, July’s “goldilocks” economic data was followed at the end of the month by a surprisingly weak jobs report that raised recession fears and roiled markets.
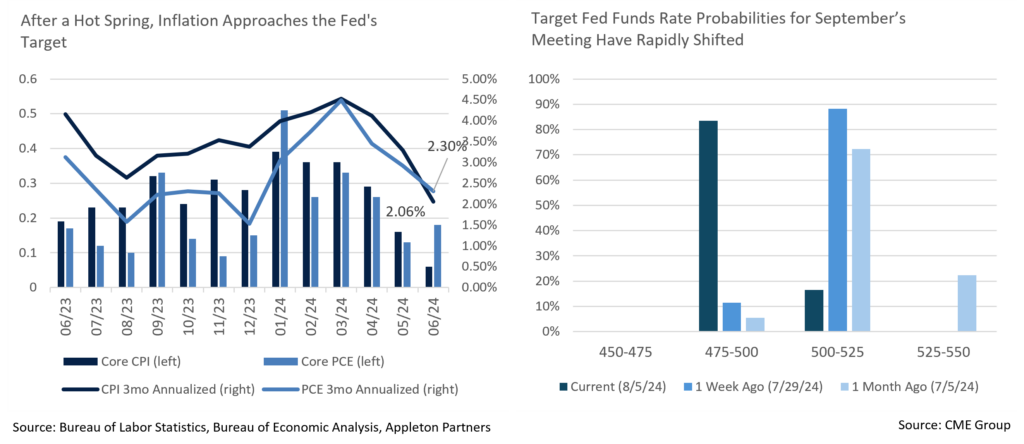
- July’s inflation reports, covering the month of June, were excellent. CPI could not have been much better, with a headline -0.1% drop and a core reading that barely rounded up to a below consensus +0.1%. While it’s taken longer than expected, the +0.2% monthly shelter costs were the lowest in years and annualized to the pre-pandemic norm of +3%. Looking at 3-month annualized CPI offers a better indicator of the current inflation picture than the trailing year, and June’s +2.06% is essentially at the Fed’s +2% target and has fallen sharply from +4.53% measured over the first three months of the year.
- The June PCE released at month-end was unremarkable, rounded up to an in-line +0.1% headline and +0.2% core inflation reading. The YoY core report came in a tenth higher than expected at +2.6%.
- The first estimate of annualized Q2 GDP was solid; +2.8% easily exceeded expectations of +2.0%. As expected, the growth rate was boosted by an inventory rebuild contribution that largely offset last quarter’s inventory drawdown. Personal consumption was solid at +2.3%, and final sales to domestic purchasers, and to private domestic purchasers, were both robust at +2.7% and +2.6%. Overall, it was a solid quarter although the “soft landing” investors have long sought was thrown into question at the end of July by weakening labor market conditions.
- The Conference Board’s June report on labor market confidence worsened unexpectedly and July’s release fell even further. Fuel was added to the fire on August 2nd when the Bureau of Labor Statistics reported that only 114,000 jobs were added in July, a sharp decline from June, and unemployment rose to 4.3%.
- US Treasuries surged in response as yields fell from 4.13% on July 31st to 3.79% as trading opened on August 5th. Equities plunged, ending an atypically long period without a major shock to risk assets. Volatility has reared its head once again, at least temporarily.
- The question now is the extent and speed of Fed Funds rate cuts, not when that cycle will begin. The latest futures data suggests 0.50% cuts in September and November, and another 0.25% in December, although a more positive ISM report on August 5th may somewhat ease fears and slow the pace of cuts.
- Politics is not taking a back seat to economic data. First, an assassination attempt on former President Trump shocked the nation. Then, bowing to growing party pressure, President Biden ended his campaign on July 21st, endorsing Vice President Kamala Harris to run in his place. This dramatic development set off a surge in Democratic enthusiasm and fundraising, altering the trajectory of a high stakes Presidential race.
- While the markets are still primarily focused on Trump as an inflation risk, neither candidate is likely to do much to stem longer term deficit issues, and there’s a risk this could eventually add to upward pressure on long yields regardless of who wins. For the moment though, the Treasury market is far more focused on economic data.
From the Trading Desk
Municipal Markets
- July’s yield move had a steepening effect with the short end of the AAA municipal curve coming down more than longer maturities. The 2-year yield fell by 25bps with the 10-year moving down only 5bps, according to MMD.
- A move towards curve normalization gained ground as the spread between 2s and 10s began the month at 23bps and ended July at just 3bps. Weak labor market data shook up markets as August began, reinforcing expectations of multiple rate cuts beginning in September. We expect this process to drive down the front end of the curve.
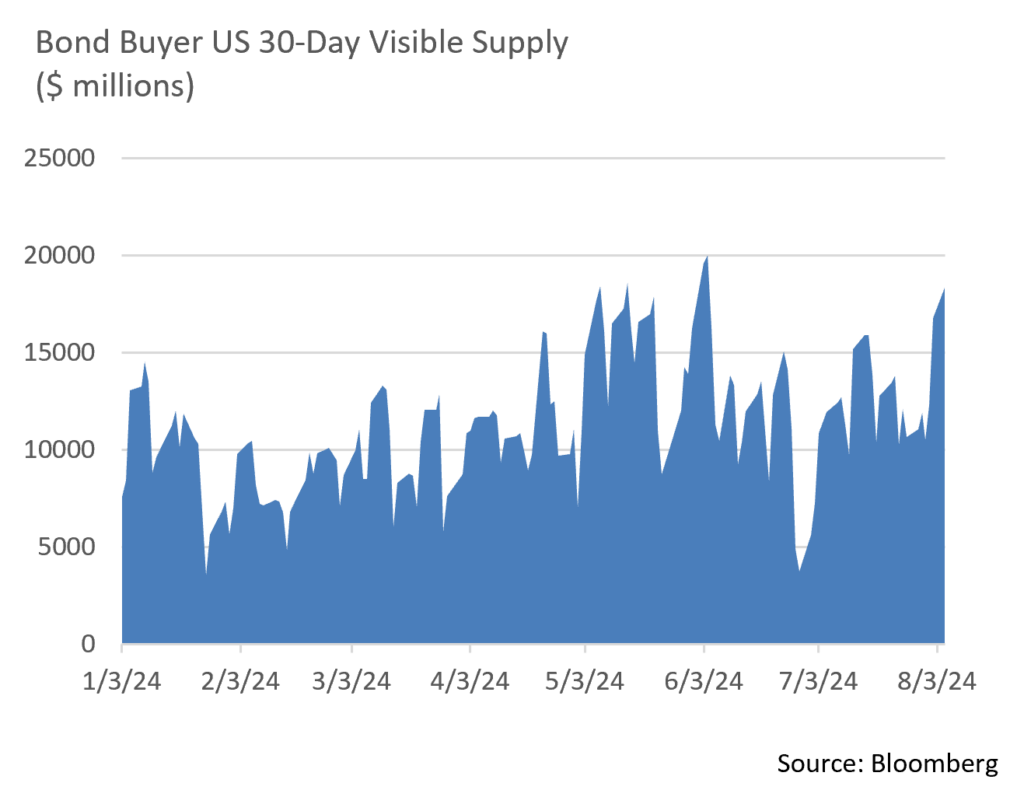
- Supply continues to dominate municipal technicals. According to Merrill Lynch, YTD issuance is up 33% through July relative to the same period of 2023. August has begun with heavy issuance and Bond Buyer 30-day visible supply is at a recent high of over $18 billion. We expect supply to be well received by investors, in part given that August’s reinvestment proceeds of $45 billion are well above July’s $36 billion.
- Recent market moves driven by a sudden decline in UST yields have caused the 10Yr AAA Muni/UST ratio to rise above 70%, a level that we feel offers value. To start the year, ratios were stubbornly stuck in a high 50% range and have spent the last several months in a 60% range. Over the longer term, we believe 10-year ratios are likely to settle in between 60% and 70%.
Corporate Markets
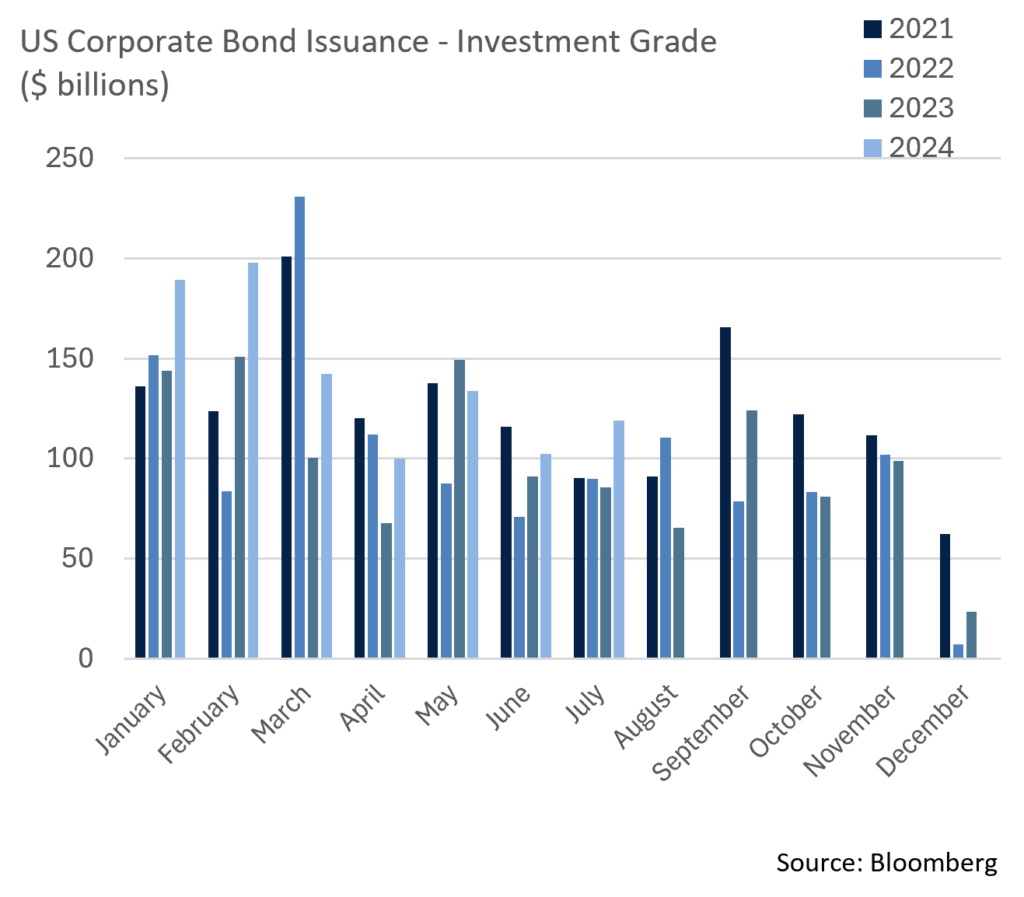
- Reception to the high volumes hitting the Investment Grade primary market remains very strong. The $118.9 billion of new debt that came in July fell just shy of July 2017’s record of $123 billion. Year-to-date new issue concessions (the added cost of issuing bonds) have been modest at 3.6bps and new deals have been an average of 3.7 times oversubscribed. July’s averages were even stronger with concessions of only 1.3bps and orderbooks oversubscribed by about 4 times.
- July’s spread movement was minimal and only produced 1bp of widening. The 94bps month-ending OAS was just 2bps higher than the YTD average of 92bps. An incredibly strong supply/demand metric continues to keep spreads stable, with the range limited to 20bps over the course of the year.
- Spread movement and risk sentiment are typically dictated by economic news and the Federal Reserve’s short term rate policy. Weak labor market reports prompted a rapid rally in UST prices and an equity market sell-off as the calendar turned to August, although IG credit has thus far held up well. Spreads widened initially by about 10bps before falling back several basis points.
- According to Lipper data, Short and Intermediate Investment Grade funds recorded ~+$3.57 billion in net inflows on the month and High Yield bond funds received ~+$4.48 billion in inflows, offering a further indication of healthy demand for credit. The “risk-off” move referenced above is testing investor sentiment, although we are not expecting IG Credit demand to materially decline.
- Supply may become challenging longer term for the US Treasury markets as $16.7 trillion of new securities have been issued in 2024 through the end of July, a 43.2% YoY increase. July’s $2.6 trillion was the largest month of issuance this year and just over $2 trillion of that was in short maturity Bills.
Public Sector Watch
Urban Centers Face Commercial Conversion Challenges
- Over four years after the start of the pandemic, cities across the nation continue to face strains related to remote work and sluggish downtown activity, a dynamic that is pressuring commercial building values and budgets. The financial impact of increased vacancies varies widely, and in many cases, it has been muted.
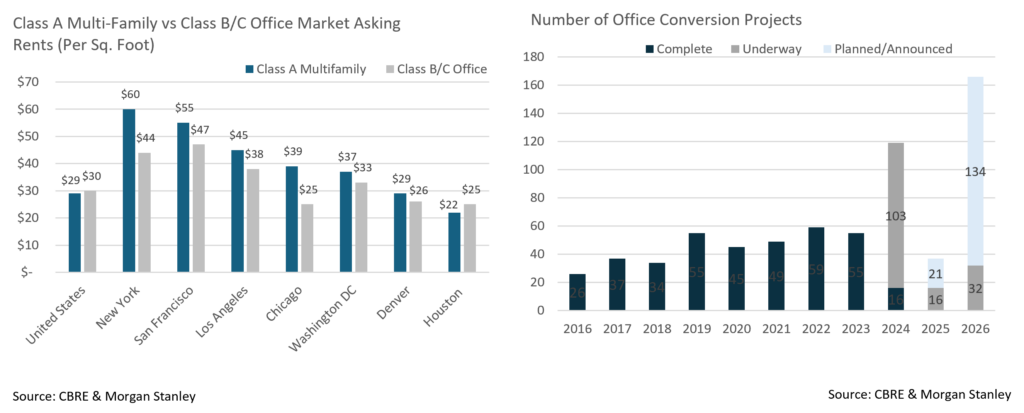
- The silver lining of commercial real estate vacancies is that it presents a timely social opportunity – converting underutilized office buildings into multifamily residences to meet critical housing needs. Morgan Stanley recently reported that national average office vacancy rates are about 17% (up from 13% pre-pandemic), and there is an estimated housing shortage of 1.5-6.0 million units. While conversion of commercial property to residential may seem like a straightforward solution, the feasibility and economics of the process are highly complex.
- While there are many reasons why office conversions are often difficult to achieve, the primary reason lies in prohibitive costs. Morgan Stanley reported there are three primary expenses associated with conversion – acquiring the office building, construction and labor supplies, and the difference in rents between office and multifamily units, with office rents typically being higher.
- While in some markets, office rents are lower than multifamily, in most large cities with critical housing needs this is not the case. For the economics of conversions to make sense, office rents must decline, or residential rates significantly increase. The regulatory environment, including zoning and building code requirements, can also add substantial costs and slow the process.
- Despite several factors working against office conversions, many cities are actively encouraging conversions, largely through tax incentives.
- Mayor Michelle Wu announced a program in Boston offering developers a tax break of up to 75% on residential property tax rates for 29 years when converting office buildings to residential housing. Construction would have to start by October 2025 and applicants must meet inclusionary zoning requirements and green energy standards.
- New York City enrolled 64 buildings in their Office Conversion Accelerator program which is aimed at helping building owners navigate complex rules and building codes by connecting them with regulatory experts. Four buildings have begun the conversion process so far, which is expected to create 2,100 housing units.
- Washington DC has been hit particularly hard post-pandemic. In response, Mayor Muriel Bowser announced a 20-year tax abatement program to spur downtown residential conversions.
- San Francisco voters approved Proposition C, allowing for a one-time transfer tax exemption for property tax owners who convert office buildings to housing before 2030. This referendum was aimed at helping the city meet a state mandate to create thousands of new homes.
- While many cities are committed to making downtown revitalization progress and expanding housing availability through office conversion, units are unlikely to be repurposed on a large scale anytime soon. Our Credit Research team is carefully monitoring the financial effects of the post-pandemic economy on cities we evaluate for potential bond investment. Commercial vacancies and overall urban health is a key factor.
Composite Portfolio Positioning (As of 7/31/24)
Strategy Overview
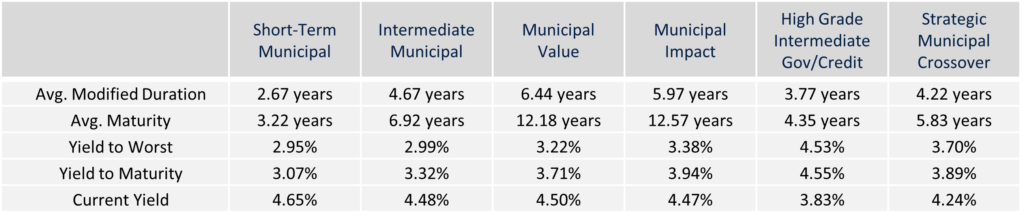
Duration Exposure (as of 7/31/24)
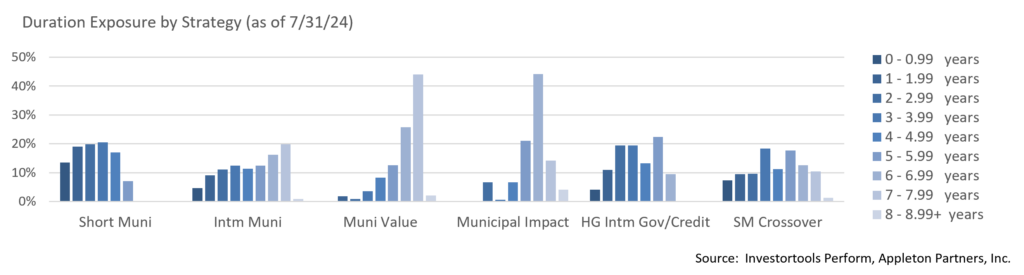
The composites used to calculate strategy characteristics (“Characteristic Composites”) are subsets of the account groups used to calculate strategy performance (“Performance Composites”). Characteristic Composites excludes any account in the Performance Composite where cash exceeds 10% of the portfolio. Therefore, Characteristic Composites can be a smaller subset of accounts than Performance Composites. Inclusion of the additional accounts in the Characteristic Composites would likely alter the characteristics displayed above by the excess cash. Please contact us if you would like to see characteristics of Appleton’s Performance Composites.
Yield is a moment-in-time statistical metric for fixed income securities that helps investors determine the value of a security, portfolio or composite. YTW and YTM assume that the investor holds the bond to its call date or maturity. YTW and YTM are two of many factors that ultimately determine the rate of return of a bond or portfolio. Other factors include re-investment rate, whether the bond is held to maturity and whether the entity actually makes the coupon payments. Current Yield strictly measures a bond or portfolio’s cash flows and has no bearing on performance. For calculation purposes, Appleton uses an assumed cash yield which is updated on the last day of each quarter to match that of the Schwab Municipal Money Fund.
Our Philosophy and Process
- Our objective is to preserve and grow your clients’ capital in a tax efficient manner.
- Dynamic active management and an emphasis on liquidity affords us the flexibility to react to changes in the credit, interest rate and yield curve environments.
- Dissecting the yield curve to target maturity exposure can help us capture value and capitalize on market inefficiencies as rate cycles change.
- Customized separate accounts are structured to meet your clients’ evolving tax, liquidity, risk tolerance and other unique needs.
- Intense credit research is applied within the liquid, high investment grade universe.
- Extensive fundamental, technical and economic analysis is utilized in making investment decisions.
This commentary reflects the opinions of Appleton Partners based on information that we believe to be reliable. It is intended for informational purposes only, and not to suggest any specific performance or results, nor should it be considered investment, financial, tax or other professional advice. It is not an offer or solicitation. Views regarding the economy, securities markets or other specialized areas, like all predictors of future events, cannot be guaranteed to be accurate and may result in economic loss to the investor. While the Adviser believes the outside data sources cited to be credible, it has not independently verified the correctness of any of their inputs or calculations and, therefore, does not warranty the accuracy of any third-party sources or information. Any securities identified were selected for illustrative purposes only, as a vehicle for demonstrating investment analysis and decision making. Investment process, strategies, philosophies, allocations, performance composition, target characteristics and other parameters are current as of the date indicated and are subject to change without prior notice. Not all products listed are available on every platform and certain strategies may not be available to all investors. Financial professionals should contact their home offices. Registration with the SEC should not be construed as an endorsement or an indicator of investment skill acumen or experience. Investments and insurance products are not FDIC or any other government agency insured, are not bank guaranteed, and may lose value.