Insights and Observations
Economic, Public Policy, and Fed Developments
- Once again, trade hopes and fears were the biggest market movers over the past month. The stock market initially rose on Chinese reports that a “Phase One” deal would involve a rollback of existing tariffs, despite the Trump Administration’s cautionary reaction. The deadline to impose tariffs on EU auto imports also passed without action. However, Trump surprised markets at the start of December by imposing steel and aluminum tariffs on Brazil and Argentina, accusing them of “aggressive devaluation” of their currency. Although net beneficiaries of China’s agricultural imports being redirected from the US, both nations have recently been fighting, not encouraging, devaluation. Trade hopes faded further when Trump indicated he would be happy to wait for a Phase One trade deal until after the 2020 election, and that any such deal would have to be favorable for the US. We see little reason for the Chinese to sign an agreement perceived to be detrimental to their interests and feel this development is more indicative of stalemate than negotiating posture. The possibility for missteps remains high, with additional tariffs slated to go into effect on December 15th.
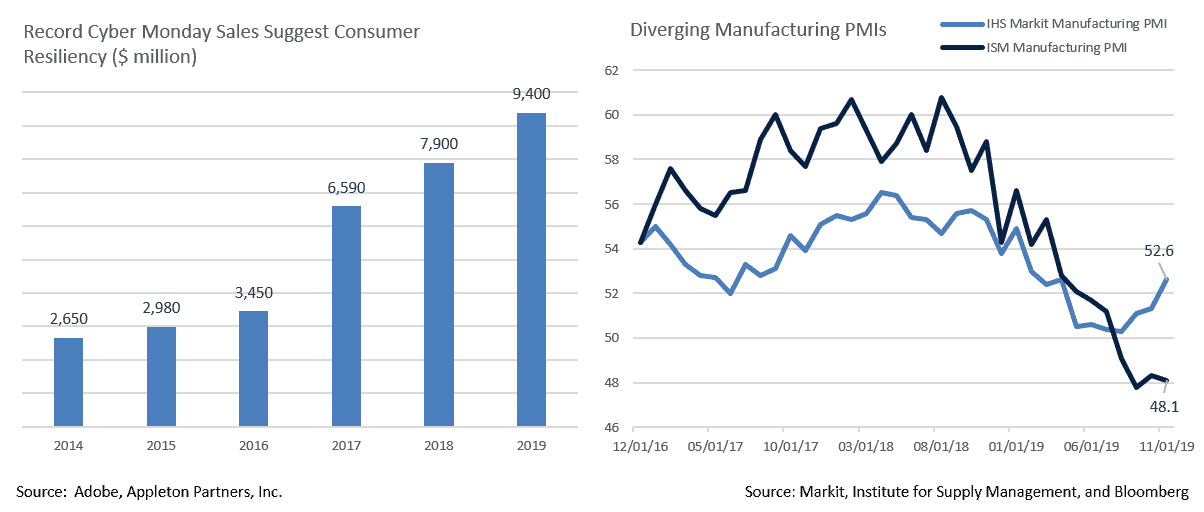
- While softening consumer confidence suggests recession fears have not yet been put to rest, we remain encouraged by the resilience of the US consumer. Retail sales beat modestly, although largely on the strength of volatile auto and gas sales. Likewise, a modest upward revision to the final University of Michigan consumer confidence survey didn’t fundamentally change a somewhat tepid reading. However, consumers came out in droves for the start of the holiday shopping season with both Black Friday and Cyber Monday posting year-over-year increases in online sales of roughly 20%. US consumers may be nervous about the economic outlook, but for now they don’t appear to be letting that discourage holiday spending. Experian reports that consumers expect to spend an average of $1,649 this holiday season, a 75% increase from 2018.
- Other economic indicators were less encouraging. Core PCE unexpectedly fell from 1.7% to 1.6%, suggesting further stimulus may be necessary to meet the Fed’s 2% inflation mandate. Durable goods orders surprised to the upside, but only just enough to maintain a flat trendline. Meanwhile, ISM manufacturing missed, slipping to 48.1 vs expectations of 49.2 (readings of less than 50 indicate contraction). An alternate measure, the IHS Markit PMI Index which favors a broader pool of smaller companies and gives more weight to new orders and output, pointed to a manufacturing recovery. A possible interpretation of this apparent disconnect is that the IHS index more readily captures the economic pulse of smaller, domestically-focused companies less susceptible to global trade.
- Odds of a Fed Funds Rate cut currently don’t exceed 50% until June, although it may become increasingly difficult for the Fed to cut rates close to the 2020 elections while maintaining a perception of political independence.

From the Trading Desk
 Municipal Markets
- The Municipal curve continued to steepen during November with the spread between AAA 2s to 10s ending the month at 44 basis points, up from lows of 20 basis points at the beginning of the quarter. The recent steepening creates an environment more favorable to selling shorter bonds and buying some longer ones than when the curve is flatter. With this in mind, we are reviewing client duration targets and looking for opportunities to extend maturities after holdings have rolled down the curve.
- As a tax efficient manager, we proactively seek to realize losses in portfolios. However, given the rate environment over the last 11 months and tight credit spreads, there are very few meaningful losses in our portfolios. Should there be client requests, we ask to be made aware as soon as possible and will review the portfolio.
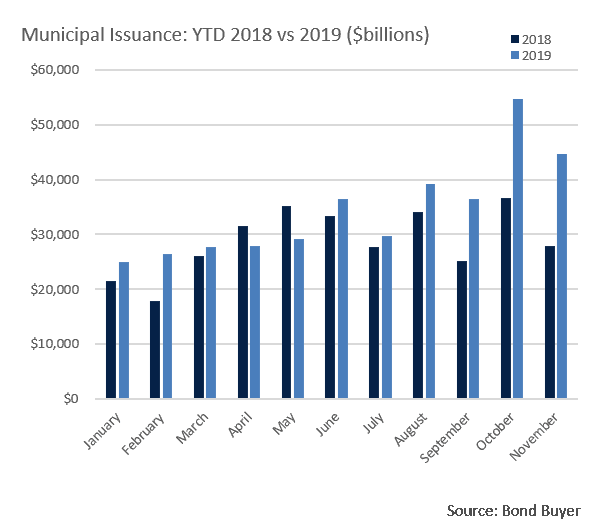
- A jump in municipal issuance has driven year-to-date totals to $377.67 billion, 11% ahead of 2018’s full year. This year began quite slowly, although more recent offerings have since catapulted issuance ahead of 2018’s pace on the back of falling rates. After a slow Thanksgiving week, $18 billion was expected to come to market the following week. As has been the case all year, demand is more than meeting supply with year-to-date municipal mutual fund flows now exceeding $84 billion.
Taxable Markets
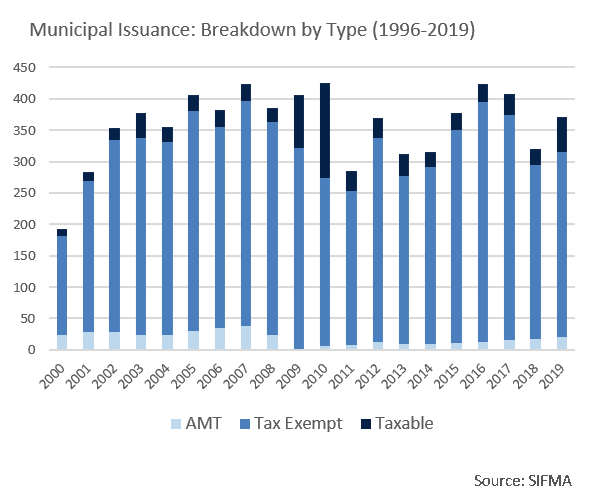
- The months of October and November produced a surge in taxable municipal Issuance. The $25.9 billion issued in those two months alone narrowly surpassed 2018’s entire total of $25.1 billion. This year’s $56.1 billion of new taxable municipal debt is already the largest annual total since the Build America Bond (BAB) market boom of 2010.
- New supply was spurred by several factors, most notably a sharp drop in yields late in the year. This created the potential to economically refund tax-exempt debt with taxable issues. At Appleton, we see this as a positive trend as it has unearthed incremental value opportunities in our High-Grade Intermediate Gov’t/Credit and Strategic Municipal Crossover strategies.
- With investment grade corporate credit spreads trading at rich levels, the ability to invest in highly rated bonds with relatively low risk profiles, no M&A exposure, and low correlation to most other asset classes can be attractive. Taxable municipals have had appeal to non-US buyers, insurers looking to meet capital requirements, and other risk-conscious liability-driven investors. Not surprisingly, California, Texas and New York have produced the largest taxable municipal supply.
Public Sector Watch
Credit Comments
Credit Research Coverage Is Comprehensive and Scalable
- At times we are asked how Appleton’s credit research team covers tax-exempt markets comprised of > 50,000 bond issuers and > 1 million total bonds outstanding. The answer lies in the alignment of our research efforts with the nature of our investment process.
- We begin by screening for quality (A or better credit rating1), size (>$100 million of outstanding debt), liquidity (active market participants) and transparency (adequate financial disclosure).
- That leads to a much more manageable investible universe of about 3,200 tax-exempt issuers. Before diving deeply into credit research, we look for specific characteristics, including a diversified economic base, strong financial profile, ability to withstand economic dislocation, timely and robust financial reporting, and secondary market liquidity.
- Rigorous, proprietary research on names that appear to meet these standards ultimately leads to “approve” or “pass” decisions along with an internal credit score.
- The scope of our credit research is demonstrated by the fact that, at present, the municipal investments we hold in client accounts are drawn from issuers that collectively account for 59% of the debt outstanding within our investible universe.2
1.Municipal Opportunity Zone Credit strategy selectively invests in BBB rated tax-exempt issuers.
2.Estimates drawn from Investortools data.
Is Climate Change a Municipal Credit Risk?
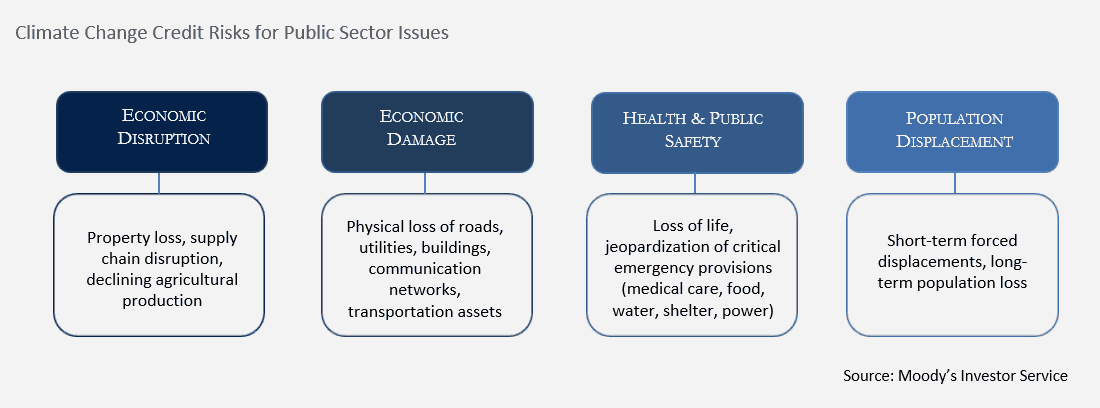
- Wildfires, hurricanes, and rising sea levels have captured the attention of investors, as the frequency and severity of these events appears to be accelerating. Setting aside human costs for a moment, the impact to municipal credit is also very real. Natural disasters can lead to service disruptions, population outmigration, tax base impairment and/or sizeable financial liabilities.
- While serious credit impact may be associated with worst-case scenarios, we incorporate these types of risks into our credit analysis and issuer scoring. In addition to analyzing a municipal issuer’s economy, budget performance, financial reserves, and balance sheet, we also assess perceived ability to combat climate change and/or natural disasters. More specifically, we look for credible long-term planning and preparedness.
- We also believe that our focus on large, well-established cities and municipal agencies provides a margin of safety compared to smaller entities when it comes to changing climate conditions. In addition to more diversified tax bases and revenue sources, larger, fiscally stable entities typically have greater access to the human and financial resources needed to prepare for and react to unanticipated events.
- We would also note that the rating agencies are incorporating climate risks into their analysis. We view this favorably. While we conduct our own analysis and formulate propriety rating scores, it is helpful to be able to factor in third-party perspectives.
Strategy Overview
Portfolio Positioning as of 11/30/19

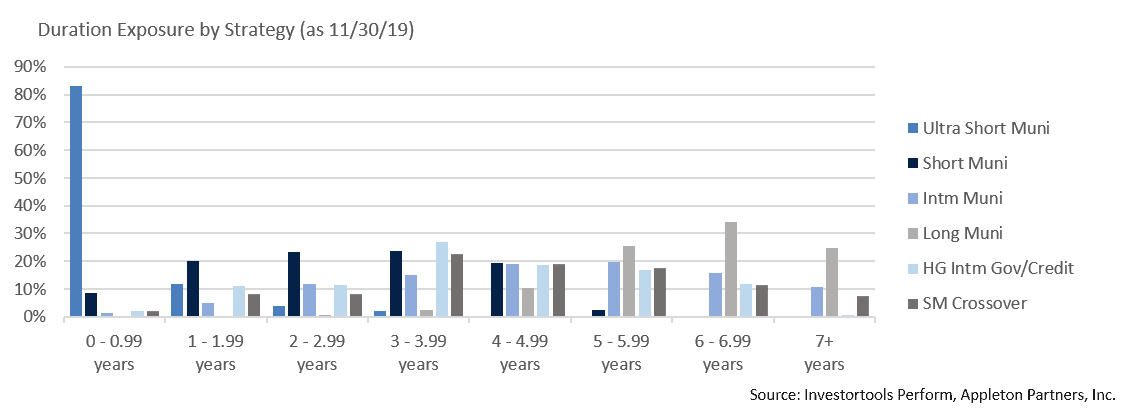
Duration Exposure by Strategy as of 11/30/19
Our Philosophy and Process
- Our objective is to preserve and grow your clients’ capital in a tax efficient manner.
- Dynamic active management and an emphasis on liquidity affords us the flexibility to react to changes in the credit, interest rate and yield curve environments.
- Dissecting the yield curve to target maturity exposure can help us capture value and capitalize on market inefficiencies as rate cycles change.
- Customized separate accounts are structured to meet your clients’ evolving tax, liquidity, risk tolerance and other unique needs.
- Intense credit research is applied within the liquid, high investment grade universe.
- Extensive fundamental, technical and economic analysis is utilized in making investment decisions.


