


Insights and Observations
Economic, Public Policy, and Fed Developments
- Geopolitical risk roiled the markets in January. A US drone airstrike killed a prominent Iranian general at the start of the month leaving the equity and oil markets on edge, although a limited Iranian retaliation helped calm markets. A Coronavirus outbreak in Wuhan, China subsequently spooked investors, sparking a Treasury flight to quality and a mild yield curve inversion even though equities have remained resilient. The virus has thankfully so far been mild, and the human cost appears likely to remain relatively low. However, aggressive containment measures, coming during the Chinese New Year where services demand is elevated, will weigh on the Chinese economy and are disrupting global supply chains. Bloomberg estimates even a contained pandemic not stretching widely beyond China could lower their domestic GDP to 4.5% for the quarter and pull full-year growth below 6%. US growth is also likely to be modestly impacted. Goldman Sachs estimated at month’s end that Coronavirus will slow US GDP by 0.4% in Q1 ’20 due to hits to tourism and trade.
- The “Phase One” trade deal was signed on January 15th. Markets largely shrugged off the news; the agreement contained less detail than was hoped, setting import targets but not specifying which goods would be bought, left Chinese tariffs on US imports in place, and offered minimal specifics concerning how China would reach the target of $200 billion above 2017 import levels. Still, we view the Phase One signing, and the signing of the USMCA on the 29th, as good news, as they make further escalation of global trade wars less likely. This removes a source of uncertainty and risk that should improve business confidence.
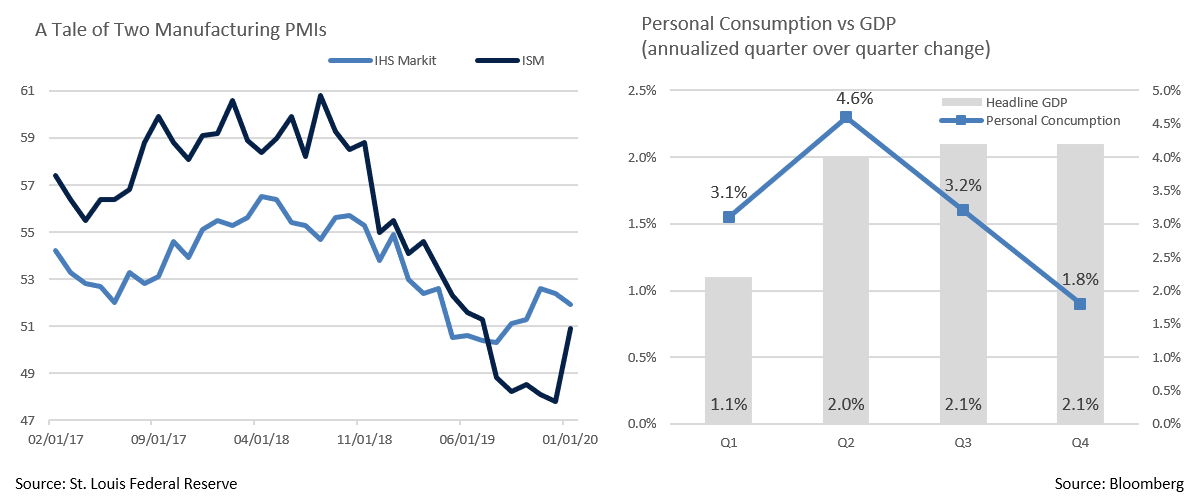
- An early sign of this improvement came with January’s ISM manufacturing report. After December’s worst reading since 2009, the index rebounded to 50.9, handily beating expectations of 48.5. In a December blog post accompanying their release, competitor IHS Markit had theorized part of the reason for the IHS index consistently exceeding the ISM in recent months was the former’s being explicitly limited to US conditions; ISM’s surge in the wake of the two trade deals being signed would support this interpretation. While still not especially strong, ISM’s return to expansion after six months of contraction was a welcome surprise, and while the Coronavirus could still impact future periods, it seems the impact on US manufacturing has so far been modest.
- The preliminary estimate of Q4 GDP released at the end of January showed growth of 2.1%, unchanged from the prior quarter. Beneath the decent headline number, though, consumption continued to slow, rising 1.8%, in line with a decelerating trend from 4.6% in Q2 and 3.2% in Q3. Business investment was also weak. The PCE deflator rose a modest 1.6% headline and 1.3% core, and the tepid pace of inflation suggests the Fed’s hope that inflation will soon return to 2% is, for the time being, just that; hope. Full year GDP growth stands at 2.3%, down from 2018’s 2.9%.
- The Federal Reserve kept short term rates unchanged, with no adjustment to outlook or risk factors in their release. Chairman Powell indicated he was intent on avoiding a permanent reduction in inflation expectations, noting “we have seen this dynamic play out in other countries.” While trading is volatile, the market now believes a rate cut is likely to occur before the November election, with two possible before year-end.

From the Trading Desk
Municipal Markets
- Operating in a low yield environment is today’s reality for advisors and tax-exempt investors. While compressed yields limit income potential, we still see opportunities for active management to generate incremental value.
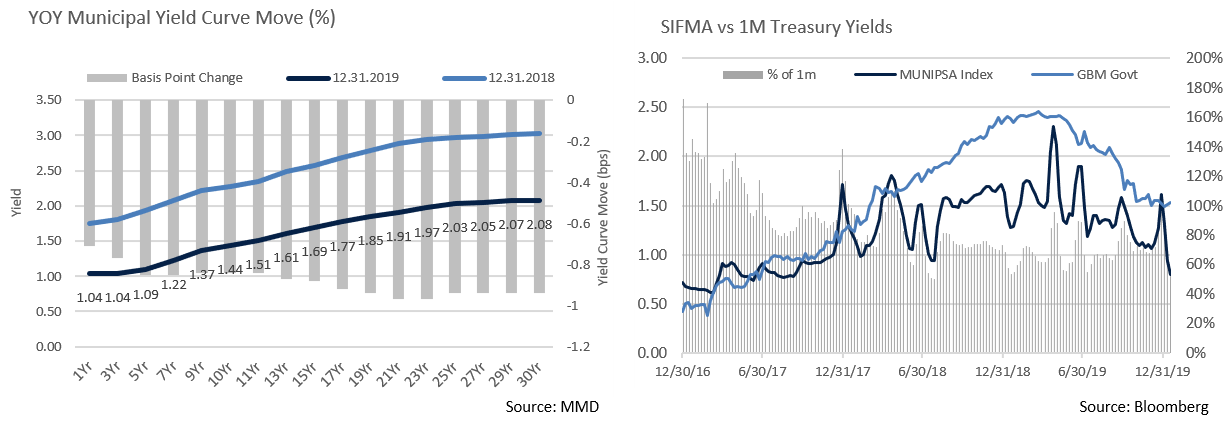
- From a relative steepness perspective, we feel the 6 to 12Yr portion of the AAA municipal curve offers the greatest value. The spread between 2-10Yr AAA municipals widened by 20 basis points to 40 basis points during Q4 ’19 before receding modestly to 32 basis points at the end of January. This compares to only a 1 basis point yield spread between 2 and 5 years. Beyond 12 years the curve also flattens out.
- We’ve also long emphasized the value of adding out-of-state exposure to in-state preference portfolios given rich pricing in certain states and limited bond availability. Doing so can open the door to relative value tradeoffs that may enhance after-tax returns after accounting for in-state taxes on bonds domiciled outside one’s state of residence. Looking at two recent AAA-rated, bond offerings of similar structure illustrates this point:
- Southern CA Metropolitan Water District, 10/1/30 callable 10/1/29 was offered at 1.00%
- Richardson, TX GO, 2/15/30 callable 2/15/29 was offered at 1.36%
- A high-tax bracket California resident buying the Richardson, TX bonds would be subject to a 13.3% state income tax, leaving a net after-tax yield of 1.18%, still well in excess of the comparable in-state bond.
- Lastly, we advise paying close attention to cash and equivalent assets. Tactically allocating between VRDNs and very short-term high-quality municipals can be effective given fluctuation in VRDN yields relative to AAA municipals and I month Treasuries.
Taxable Markets
- Investment grade issuance is off to a quick start as $133.69 billion came to market during the typically busy month of January. This marks the second largest month of issuance on record, trailing only January 2017. A flattening US Treasury yield curve continues to push down funding costs and issuers have raced to capitalize. Additionally, a $2.4 billion spike in negative yielding debt across the globe further enhanced the appeal of US debt to global investors starved for income. This seemingly insatiable demand remains highly supportive of new issue bonds and those trading on the secondary markets.
- Investment Grade spreads rallied accordingly through the first few weeks of January and performance remained solid. However, a flight to quality trade was triggered by growing Coronavirus fears and spreads subsequently widened by 5 – 10 basis points. The energy sector was hit hardest with spreads widening by 10 to 15 basis points. Global economic impact worries drove down energy prices, thereby raising credit concerns. High yield is naturally more vulnerable, but we do not see investor demand for investment grade credit waning anytime soon. This should keep the very strong bid for investment grade bonds in place.
Public Sector Watch
Credit Comments
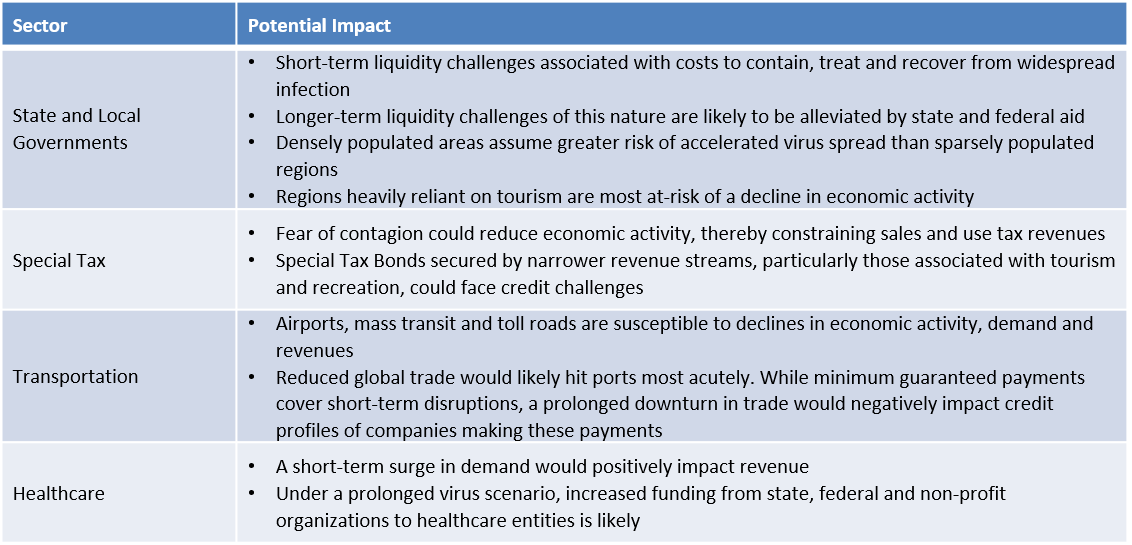
Coronavirus: Sectors and Regions Most At-Risk
- Global anxiety is rising as Coronavirus spreads in China and increasingly elsewhere around the globe. Beyond the human cost, we must think about potential follow-on municipal credit impact. While we do not yet see an immediate effect on individual municipal issuers, a prolonged health crisis could ultimately impact certain credit-specific and sector-wide fundamentals.
- In general, we feel investors ought to diversify portfolio exposure by issuer, sector and geography to help mitigate unforeseen events. And consistent with our longstanding credit preferences, we believe large issuers with seasoned leadership teams are better equipped to handle these types of situations than smaller entities with limited resources, thereby supporting credit quality and bond performance.
- As analysts, where will we focus our research efforts should the Coronavirus continue to spread?
In Volatile Energy Markets, Which States May Be Poised for Disappointment?
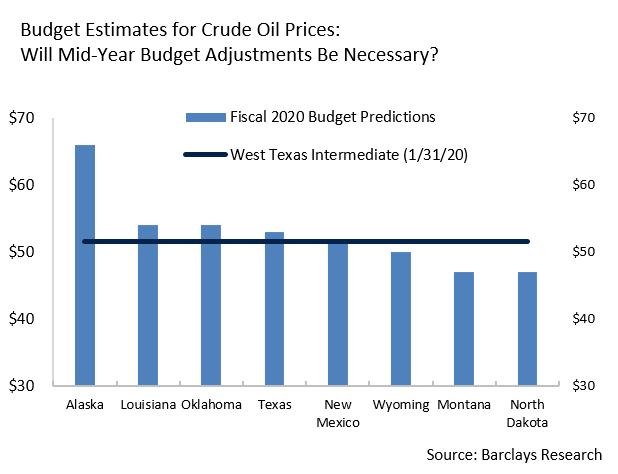 January was a turbulent month in the oil markets as prices initially surged on U.S.- Iranian tensions before slumping on global growth concerns associated with the Coronavirus.
- The accompanying chart supplied by our friends at Barclays shows current fiscal year oil price budget assumptions for oil prices, which in turn directly influence projections for severance taxes, sales taxes and even income taxes given the prominence of the oil and gas industry in these states’ economies. The data is revealing from a credit perspective. Should oil prices remain at current cyclical low levels, or even fall further, mid-year budget adjustments would likely be necessary. We remain prudent in our exposure to these names, particularly those with more aggressive projections, as there is risk that lower tax revenues could lead to wider credit spreads.
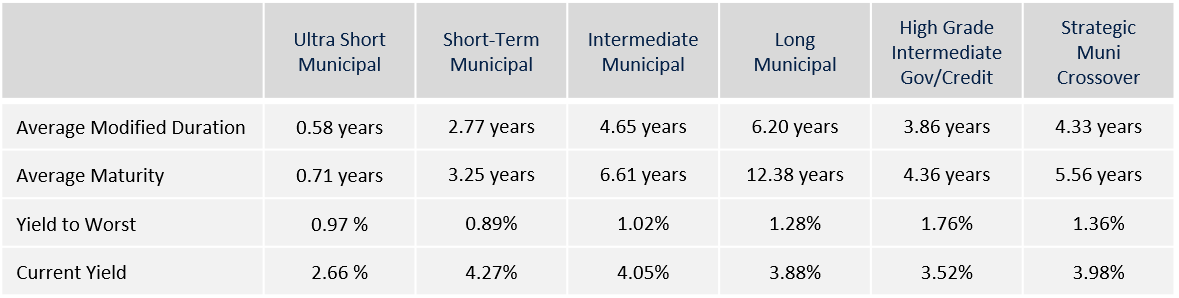
Strategy Overview
Portfolio Positioning as of 1/31/20
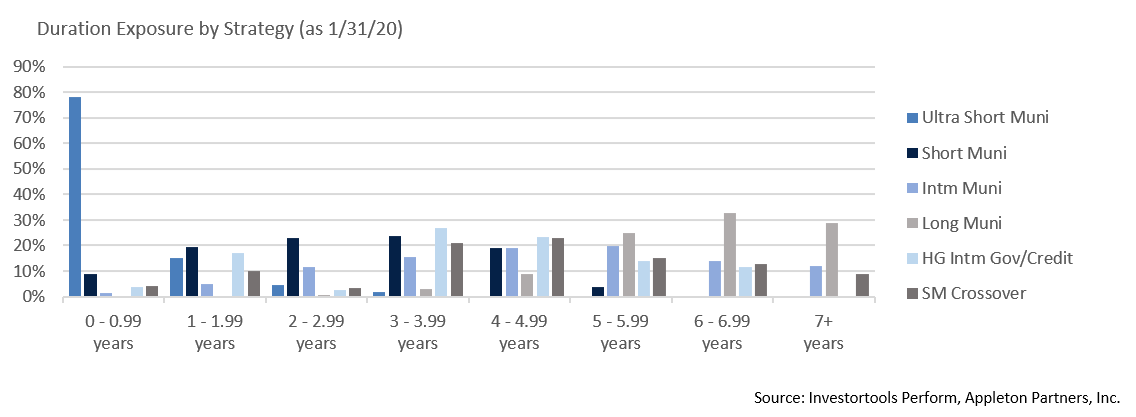
Duration Exposure by Strategy as of 1/31/20
Our Philosophy and Process
- Our objective is to preserve and grow your clients’ capital in a tax efficient manner.
- Dynamic active management and an emphasis on liquidity affords us the flexibility to react to changes in the credit, interest rate and yield curve environments.
- Dissecting the yield curve to target maturity exposure can help us capture value and capitalize on market inefficiencies as rate cycles change.
- Customized separate accounts are structured to meet your clients’ evolving tax, liquidity, risk tolerance and other unique needs.
- Intense credit research is applied within the liquid, high investment grade universe.
- Extensive fundamental, technical and economic analysis is utilized in making investment decisions.