


Insights & Observations
Economic, Public Policy, and Fed Developments
- While news coming out of Washington dominated the financial press in the second half of January, it shouldn’t entirely draw attention from the fact that, at the moment, we have a pretty good economic backdrop.
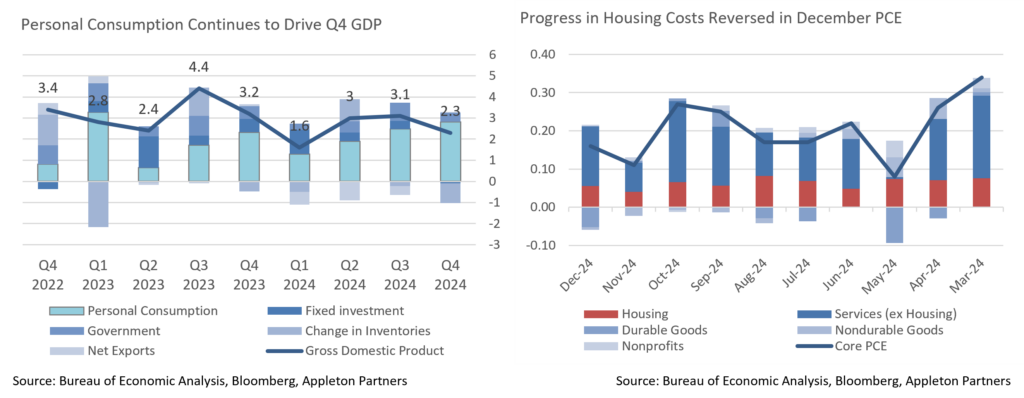
- Strong December hiring was followed by evidence of consumer strength in January. Most notable was the initial Q4 GDP print, which despite a moderate headline +2.3%, showed strong underlying consumer demand. Final Sales to Private Domestic Purchasers grew a robust +3.2%, and there was a whopping +4.2% increase in Personal Consumption. Ironically, despite anecdotal talk of tariff frontrunning, net inventories detracted nearly a point; this either leaves room for a potential upward revision to growth or is a sign that consumers were even more aggressive in frontrunning tariffs than companies.
- Speaking of tariffs, Trump began rolling these out on the last day of the month, announcing 25% tariffs on Canada and Mexico, 10% on China, and that unspecified EU tariffs were coming. The timing suggested room for negotiation, and sure enough, Mexico and Canada (though not China) have secured one-month delays. However, we’d note the anticipated range of potential trade-related outcomes has shifted significantly towards the most protectionist outcomes after initial post-election optimism.
- Meanwhile, Elon Musk has begun broad federal staffing reductions, shutting down entire offices and lines of business. Policy and legal implications aside, we would note that the federal government is the largest employer in the country, with more than 3 million Americans, or nearly 1.6% of the workforce. If there’s ever a time to reduce federal headcount it’s when a robust economy can absorb job losses, but tens to hundreds of thousands of newly unemployed federal workers may begin to weigh on growth as the year progresses. With commentary mostly focused on the political nature of these moves, the market may be underappreciating these risks.
- The Federal Reserve meeting on January 29th was largely uneventful, combining a more hawkish than expected statement with a fairly dovish press conference. A change in the statement garnered much attention, removing a reference to the labor market as having “generally eased, and the unemployment rate has moved up but remains low” in favor of calling it “solid,” and with the unemployment rate “stabilizing at a low level.” In his press conference, Powell described this as “language cleanup” rather than a meaningful change. We disagree; the Fed statement is largely static between meetings. These phrases had been in place in November and were broad enough to describe October’s outright hiring weakness; the current statement would no longer support any sign of weakness. Coupled with removal of language referencing progress on inflation, we believe this signals a Fed turning back from employment to the inflation side of their mandate.
- Ironically, this follows a decent stretch of inflation data. While we’re hardly out of the woods yet, December brought good news for both CPI (where Headline came in a tenth high but Core beat by a tenth) and PCE (where Core came within a few hundredths of rounding to a beat, though with a snap-back in housing costs after November’s improvement). January marks the start of a quarter with favorable year-over-year comps, which may help annual rates, but also one where seasonal factors have in the past pushed inflation higher, particularly in January.
Source: Bureau of Economic Analysis, Bureau of Labor Statistics , US Dept. of Commerce, Pew Research, Bloomberg
From the Trading Desk
Municipal Markets
- Over the last month, the muni curve bull steepened with the 2Yr down 15bps and the 10Yr down 9bps. The end of January saw the spread between 2s and 10s at 30bps, 6 bps steeper than where it started the month at 24bps. Interestingly, the longer part of the curve has also steepened, with the spread between 2s to 30s moving up to 130bps from 108bps, it’s level at the beginning of the month.
- Throughout 2024, increased supply was a highlight, and that trend continued through January. January 2025 issuance was 18% above levels for the month in the previous year. We are also watching issuance levels for February, which is generally a lighter month. According to Bloomberg, over the past 10 years issuance in the month has averaged $29.9 billion. However, we may see another period of elevated issuance in February due to the fear of the tax exemption being eliminated and issuers attempting to get ahead of any changes that may negatively impact the market. We note that based on the consensus of many market strategists, we believe the threat of elimination of the tax exemption to be remote. 30-day visible supply does not yet reflect an increased level at just $8.7 billion.
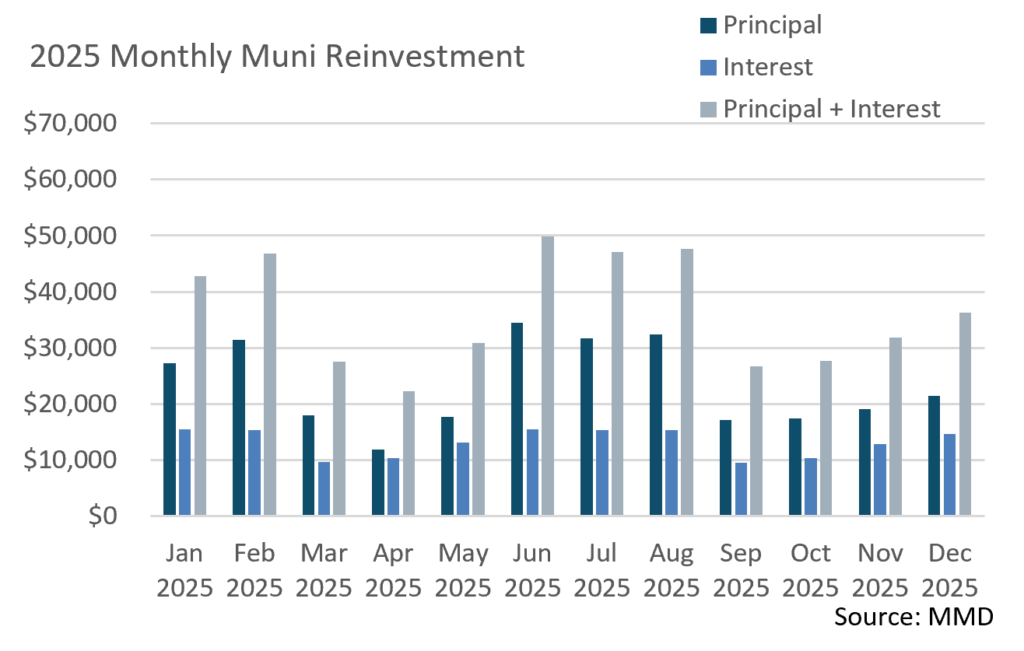
- Demand should remain intact during February due to heightened reinvestment levels. January reinvestment, including both principal and interest, totaled over $42 billion. However, February reinvestment at over $46 billion, is projected to be the highest until June. Leading the redemptions are Texas, California, and New York, which make logical sense given that these States are also the most prolific issuers.
Corporate Markets
- As market fundamental strength spilled over from the end of 2024 and into the start of 2025, January expectations for US IG issuance reached $175 billion. Issuers were active the last week of the month, and the pursuit of a record setting January was in sight. However, the January Fed meeting diminished momentum, leaving the last week’s total at $31.6 and the month at $186.4 billion. This was just $3 billion short of the record set in January of 2024, while the 10 year average for the month of January is $138 billion. February has the potential to be just as busy with $175 billion of new debt coming to market and the total amount expected in 2025 is $1.5 trillion. The new issuance landscape continues to be attractive with UST rates only slightly higher YTD, low concessions needed to get deals done, and insatiable demand ready to absorb the new debt.
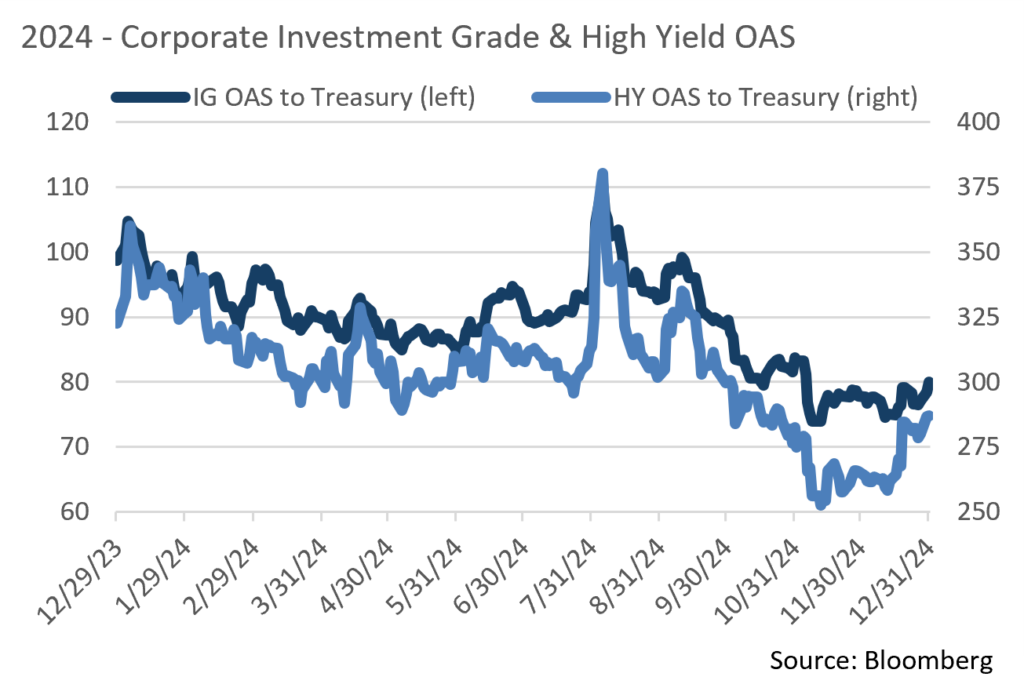
- Throughout 2024, we mentioned the overall resiliency that IG credit spreads had displayed throughout the year, with the average OAS on the Bloomberg US IG index at 89bps vs. the 124bps average over the last 10 years. This average includes a 2 month window in 2020 where spreads gapped out due to COVID. The low during that time was set back in November 2024 at 74bps, and January closed at an OAS of 79bps, just 5bps off of the 10 year low. It is still our view that spreads should remain range bound in the near term but could come under pressure as risk sentiment shifts have become more varied. Demand in both the primary and secondary markets remain very strong though.
- Lipper fund flow data continues to be positive for new money flows into Taxable funds. During the week ending January 29th, flows into Short and Intermediate IG bond funds was $1.34 billion. This follows a week with $914.8 million of positive flows recorded. For the month, total flows came in at $5.24 billion. While this isn’t the most robust start to a January for IG fund flows, it does still represent continued interest and demand by investors. High Yield bonds saw a positive $194.8 million inflow, as did UST funds with $2.12 billion and leveraged loan funds drawing in $1.5 billion in new flows.
Source: MMD, Bloomberg
Public Sector Watch
An Update on the Los Angeles-Area Wildfires
Our thoughts are with our clients, business partners, and all individuals whom the Los Angeles area wildfires have impacted.
Beginning on January 7, a number of severe wildfires sparked and spread across Southern California. A combination of severely dried vegetation serving as ripe tinder and the strong Santa Ana winds allowed fires to ignite and quickly engulf vast expanses of land and property. Combined insured losses are likely to exceed $30 billion, nearly triple the 2018 Camp Fire, previously the State’s most damaging fire event.
LA Department of Water & Power (LADWP): Potential Credit Risk
The Palisades wildfire, which has resulted in 12 reported deaths, covered 23,400 acres, and destroyed 6,800 structures, occurred within the Los Angeles Department of Water and Power’s (the “Department”) service area. A component of the City of Los Angeles, the Department provides water and electrical services and issues municipal bonds separately for its Power System ($11.5 billion outstanding) and its Water System ($6.9 billion). Appleton owned Department Power and Water System bonds in certain client accounts when the wildfires started.
There has yet to be evidence pointing to the Power System’s infrastructure as responsible for fire ignition, although the investigation remains active. A lawsuit has been filed against the Water System, and the State has requested an investigation into failing fire hydrant water pressure and an empty reservoir that was waiting for repairs. A risk remains that either or both the Power and Water Systems are found liable for property damage caused by the fires. If that were to occur, the Department has internal financial resources, insurance coverage, unregulated rate-setting authority, and unregulated bonding ability (within practical limits). External resources such as the State or a separate mechanism like a securitization program may ultimately help support funding the liability.
As we see it, investors must assess the likelihood of several principal risks:
1) the Department being found liable
2) the size of any potential liability
3) the financial impact on the Department
4) how the market would price those developments
Appleton’s credit opinion evolved as events unfolded and we recently determined that the near-term upside potential of bond price recovery is limited, while eventual resolution is likely to stretch over an extended period as headline risk overhangs. There is also the real risk that even if the Department is cleared of culpability, its bonds may not fully recover as the market prices in the future risk of wildfire occurrences and California’s strict accountability statute.
The “tail risk” of a large financial liability, coupled with our investment team’s ability to execute sales at prudent levels (in our opinion), led us to commence a widescale selling program in mid-January. These trades were executed at spread levels we deemed “fair” given the downside risk potential. As of January 31st, Appleton clients no longer have exposure to the Los Angeles Department of Water and Power.
Credit Impact Manageable for Other Appleton-Approved L.A. Names
Appleton also owns other municipal issuers located within Los Angeles County that have revenue or service area exposure to the wildfires. We expect short-term challenges associated with cleanup and debris removal, delayed tax revenues, and additional costs to help kickstart rebuilding. However, we believe that beyond LADWP, Appleton-owned credits will not incur long-term credit challenges. This belief is supported by large and diverse service areas and tax bases that extend beyond the wildfire-impacted communities, revenue diversity, and an ability to rely on vast balance sheet resources. State and Federal grants and reimbursements should also help to cover associated costs.
Our belief that Appleton-owned credits will successfully weather through is also rooted in a longstanding preference for investing in large, well-established issuers. Large issuers are not immune to unforeseen events, although they typically have the financial resources, managerial expertise, and access to the external support needed to maintain credit quality in the face of natural disasters. By contrast, more acutely impacted issuers are typically those that rely on a narrow tax base, operate single-site facilities, and/or have limited balance sheet resources. Appleton has long avoided these sectors as well as smaller entities.
Source: CoreLogic, CAL FIRE, Los Angeles Department of Water and Power financial statements
Composite Portfolio Positioning (As of 1/31/25)
Strategy Overview
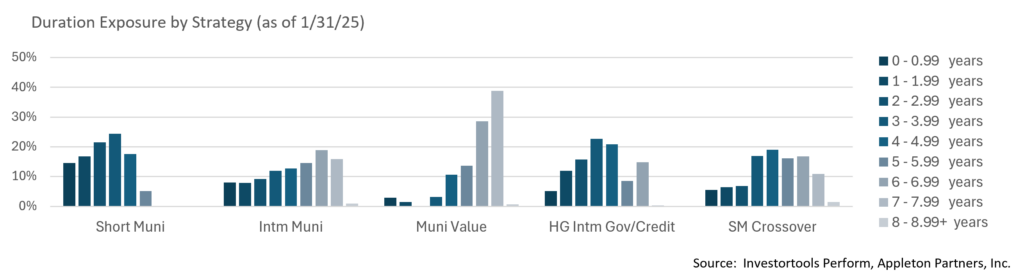
Duration Exposure (as of 1/31/25)
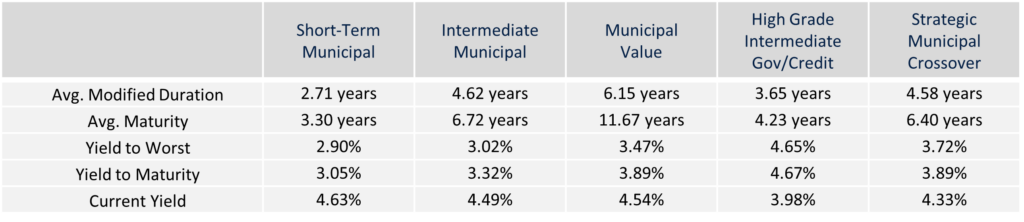
The composites used to calculate strategy characteristics (“Characteristic Composites”) are subsets of the account groups used to calculate strategy performance (“Performance Composites”). Characteristic Composites excludes any account in the Performance Composite where cash exceeds 10% of the portfolio. Therefore, Characteristic Composites can be a smaller subset of accounts than Performance Composites. Inclusion of the additional accounts in the Characteristic Composites would likely alter the characteristics displayed above by the excess cash. Please contact us if you would like to see characteristics of Appleton’s Performance Composites.
Yield is a moment-in-time statistical metric for fixed income securities that helps investors determine the value of a security, portfolio or composite. YTW and YTM assume that the investor holds the bond to its call date or maturity. YTW and YTM are two of many factors that ultimately determine the rate of return of a bond or portfolio. Other factors include re-investment rate, whether the bond is held to maturity and whether the entity actually makes the coupon payments. Current Yield strictly measures a bond or portfolio’s cash flows and has no bearing on performance. For calculation purposes, Appleton uses an assumed cash yield which is updated on the last day of each quarter to match that of the Schwab Municipal Money Fund.
This commentary reflects the opinions of Appleton Partners based on information that we believe to be reliable. It is intended for informational purposes only, and not to suggest any specific performance or results, nor should it be considered investment, financial, tax or other professional advice. It is not an offer or solicitation. Views regarding the economy, securities markets or other specialized areas, like all predictors of future events, cannot be guaranteed to be accurate and may result in economic loss to the investor. While the Adviser believes the outside data sources cited to be credible, it has not independently verified the correctness of any of their inputs or calculations and, therefore, does not warranty the accuracy of any third-party sources or information. Any securities identified were selected for illustrative purposes only, as a vehicle for demonstrating investment analysis and decision making. Investment process, strategies, philosophies, allocations, performance composition, target characteristics and other parameters are current as of the date indicated and are subject to change without prior notice. Not all products listed are available on every platform and certain strategies may not be available to all investors. Financial professionals should contact their home offices. Registration with the SEC should not be construed as an endorsement or an indicator of investment skill acumen or experience. Investments and insurance products are not FDIC or any other government agency insured, are not bank guaranteed, and may lose value.