Insights & Observations
Economic, Public Policy, and Fed Developments
- The incoming “Trump 2.0” Administration’s policy priorities remain in flux, and House Speaker Johnson’s near failure to be seated is a fresh reminder of the thin legislative path open to the GOP. With so much still unknown, major market impacts are likely to come from public policy, but for now we will focus on hard economic data.
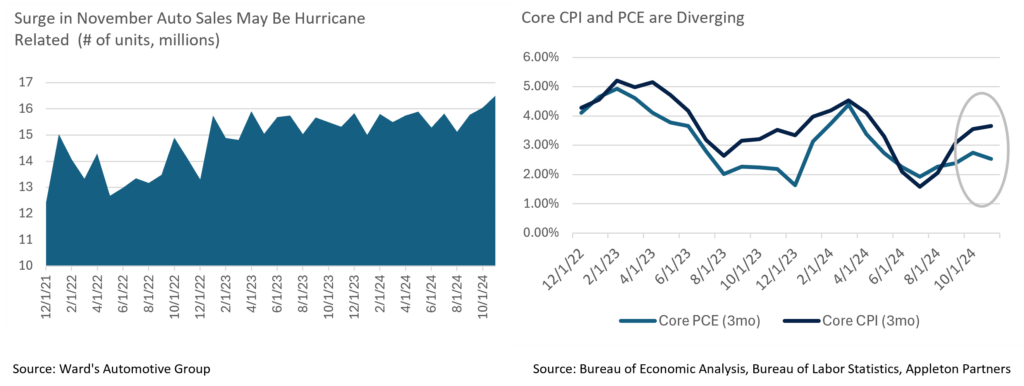
- Consumers still appear to be spending. Retail sales were solid in November, with headline surprising a tenth to the upside at +0.7%, with a substantial contribution from auto sales. This supports the theory that the hurricanes in the fourth quarter led to a surge in replacement car purchasing. Ex-auto and gas was weaker, but the “control group” sales, which feeds into GDP calculations, was still solid at +0.4%. Consumers often cut back after big-ticket purchases like cars, so it will be important to see how durable this trend proves to be.
- This strength was mirrored in the final Q3 GDP revision, which unexpectedly increased from +2.8% to +3.1%. Much of the strength came from upward revisions to consumption, now +3.7%. Final sales to domestic purchasers and to private domestic purchasers continue to show exceptional demand as well, at +3.7% and +3.4%, respectively.
- Inflation remains a mixed bag. A fourth consecutive +0.3% Core CPI print didn’t deter the Fed from cutting rates a further 25bps in December. While January through March introduce high year ago comparisons that may allow the YoY rate to drop, the 3-month annualized rate now sits at nearly +3.7%, higher than the trailing 12 month’s +3.3%; base effects alone won’t return core inflation to the Fed’s 2% target.
- However, PPI and PCE were more encouraging. Headline PPI came in hot, but 80% of the increase was in food prices, thanks to a 56% increase in the cost of eggs due to avian flu. We expect policy makers to look through the headline to the better-than-expected ex-food, energy, and trade numbers. PCE was an unabashedly good report that exceeded solid expectations, beating headline and core by a tenth at +0.128% and +0.115% respectively, with “super-core” falling to +0.159% as services inflation cooled.
- Employment rebounded in December with growth of 227k jobs, slightly above expectations that had already been raised in the days before the release. Prior period revisions of +56k suggest the previous month wasn’t quite as bad as initially thought. However, the two-month average is still low, and with survey responses suggesting companies are still delaying investment decisions until they have greater fiscal clarity, the post-election rebound we expect is likely to take several months to play out. We continue to believe the labor market is in better shape than the weak consensus view.
- The pivotal moment in the December FOMC meeting came during the press conference, when Powell was asked how expected fiscal policy changes under the Trump Administration had been factored into the Fed’s dot plot. “Some people did take a very preliminary step and start to incorporate highly conditional forecasts of policy into their estimations, some did not, and some didn’t say,” Powell answered. Yields soared and stocks fell in response on the implication that the upward movement in December’s dot plot was likely only a precursor of moves higher in future meetings. After rising steadily into the meeting in expectation of a “hawkish cut,” the 10Yr UST broke through prior resistance at 4.50%, ultimately reaching an intra-day high of 4.64%. Since the meeting, 4.50% has held as a floor.

From the Trading Desk
Municipal Markets
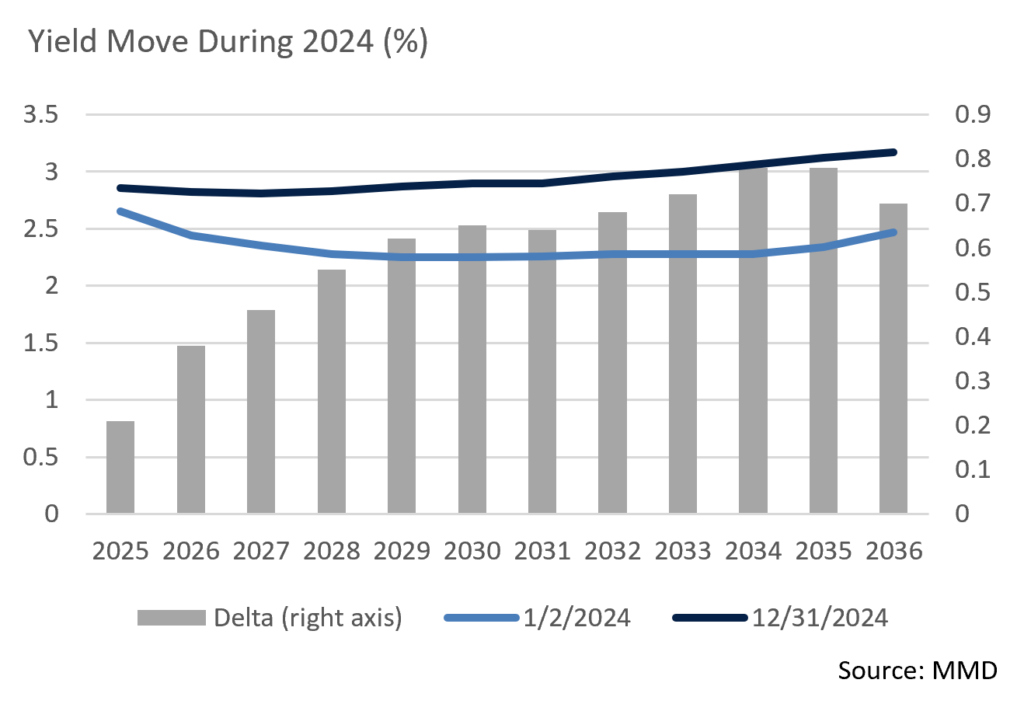
- December saw municipals selling off to the tune of 20 to 30bps across the curve. With tax efficiency a priority in many portfolios, trading was busy. The curve also steepened with the spread between 2s and 10s increasing from 19bps to 24bps, normalization that allows for yield pick-up from adding duration.
- The yield curve was higher and steeper over the course of the year. While the very front end of the municipal curve (<3 years) remains moderately inverted, the rest of the curve has steadily become upward sloping. Over the full year, 3-year yields rose 46bps, 5-years were up 62bps, and 10-years 78bps. While adding incremental duration now offers greater yield pick-up, 2024’s bear steepening trend produced short-term price pressure.
- Ratios were also higher as municipals underperformed USTs. The 10-year AAA/UST ratio began 2024 in the mid-50s, and this proved to be the richest point of the year. Ratios were somewhat volatile but ended 2024 at 66.5%.
- Issuance was heavy throughout 2024 and closed with a record of $507.6 billion, a 32% increase over 2023 (The Bond Buyer). The previous high-water mark of $484.6 billion occurred in pandemic-impacted 2020. This year’s elevated issuance was driven by a backlog of projects, recession fears, and an effort to get ahead of the November election. Inflation was also a factor as it contributed to an increase in jumbo-sized deals. The volume leaders in tax-exempt issuance among sectors were School Districts and Water & Sewer, as issuers funded building, infrastructure and related needs.
- California, Texas and New York remain the top state issuers. California brought over $71.6 billion to market, a sizeable 31.4% increase over last year. Texas was also a strong contributor to new bond supply, increasing issuance 15.3% YoY, while New York grew at a robust 38.8% rate.

Corporate Markets
- High grade corporate bond spreads traded within a 5bps range in December given sustained investor appetite for credit. Tight spreads persist with the Bloomberg US Investment Grade Index OAS closing the year at 80bps. Looking forward in 2025, we feel it is more likely that increased issuance will fail to meet the demands of eager investors than it is that spreads widen on supply growth.
- December, as is typically the case, was a slow month with only $41.2 billion coming to market. Issuers were all but done the week before the Christmas holiday. Nonetheless, Investment Grade issuance of $1.496 trillion in 2024 was the second largest total on record, trailing only the $1.75 trillion brought to market in 2020. Overall, deals were very well received with oversubscriptions common, nominal concessions, and tight secondary market trading spreads. We see this favorable backdrop continuing well into 2025.
- The Bloomberg US Investment Grade Corporate Index fell -1.94% in December as UST yields rose sharply. The performance drag was greatest at longer ends of the curve (-4.90% vs. -0.73% for intermediate bonds). For the full year, the index produced a +2.13% total return.
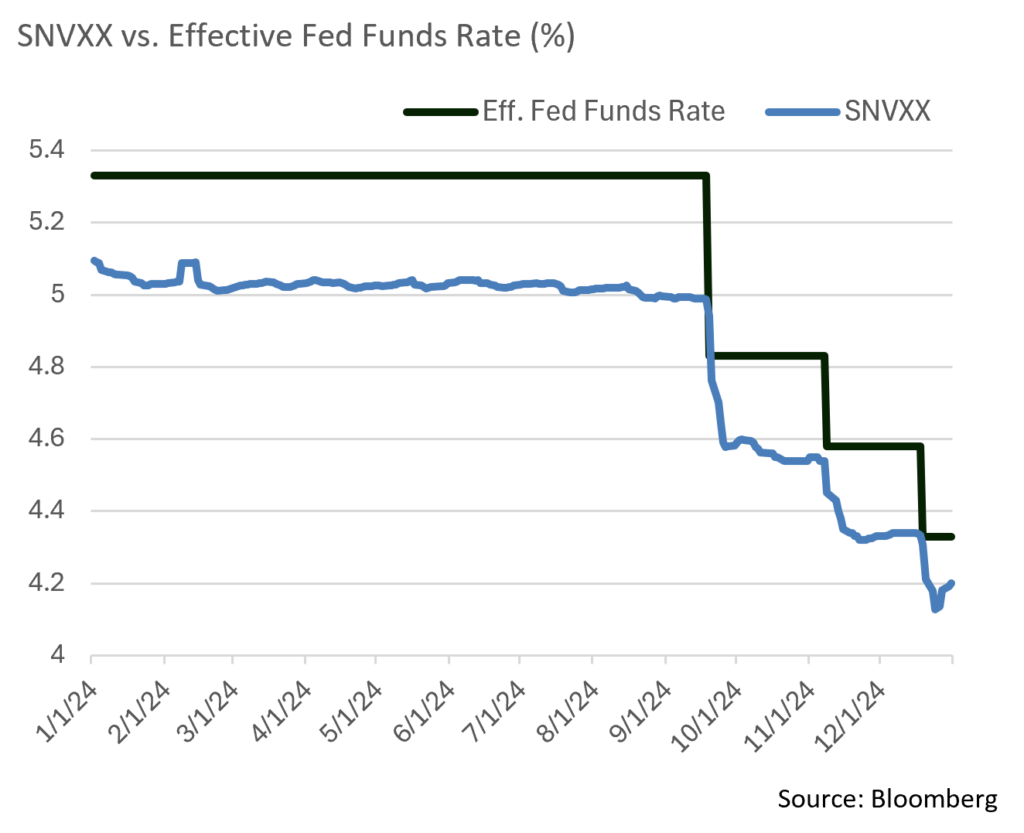
- Money market funds have attracted a tremendous amount of assets with yields remaining close to or above 5% for much of 2024. An effective Fed Funds Rate of 5.50% was the obvious contributing factor, although recent Fed Funds cuts have changed the dynamic. Money market yields are moving down in synch with Fed Funds and now more closely track longer-term bonds. Many investors are again revisiting the potential value of adding duration and locking in yields for a longer term. Current expectations call for 2 more rate cuts in 2025, a policy adjustment that would put further pressure on short-term yields.

Public Sector Watch
2025 Municipal Sector Outlook
After several years of adjusting to new norms after the Covid-19 pandemic, the municipal market has recently steadied, leading to a “stable” outlook for all sectors covered by our Credit team.1 The far-reaching “stable” outlook reflects a preponderance of conservative leadership with an emphasis on building reserves, as many issuers have seen how important that is in uncertain markets such as those experienced during the pandemic. It also reflects careful expense management with nearly all sectors facing above average inflation and an outlook for modest US economic growth in 2025. Relative to 2024, the Mass Transit and Healthcare sectors have been upgraded to “stable” from “cautious.”

Four of these sectors – state and local governments, water & sewer, and public power – generally exhibit similar trends due to their non-cyclical nature, enabling most issuers to maintain credit stability over the past few challenging years. Their outlooks reflect resiliency during prior downturns and prudent financial management.
- Water & Sewer – Given the essentiality of services provided and a self-regulated rate setting ability, revenues have largely remained stable, and in general, have had little to no operational disruptions.
- Public Power – A defensive sector with low volatility due to essentiality of services. Financial metrics should continue to be strong as past recessionary periods have historically had minimal impact.
- Local Governments – Our “stable” outlook for Local Governments is driven by an expectation of healthy revenues and lower fixed costs that should help offset growing operating expenses (primarily labor). In most cases, the two largest local government revenue sources are property taxes and state funding, and both are expected to remain healthy in 2025. We are watching the impact of commercial real estate (“CRE”), although concerns of a “doom loop” appear to be receding. Exposure and reliance on CRE varies across urban centers, but even those most exposed are likely to weather the downturn reasonably well due to valuation declines occurring over multiple years, and revenue diversity.
- State Governments – We anticipate stable fiscal conditions for most states in 2025. Economic conditions point to slightly positive-to-flat revenues, while inflation pressure on expenditures has eased. Favorably, budget officers are once again taking a conservative approach in FY ‘25, projecting only +0.3% median revenue growth according to NASBO. Should the national economy stumble, States are in relatively good shape to weather the storm. Median rainy-day balances are expected to reach 14.4% of expenses by the end of FY ‘25, compared to a 10-year average of 8.7%.
The Healthcare and Mass Transit sectors both had their outlooks revised from “cautious” to “stable.” These two sectors most acutely felt lingering pandemic effects, however, most issuers have been able to adapt and address shifting fiscal dynamics.
The Mass Transit sector faced a ridership cliff at the beginning of the pandemic that has been slow to rebound as remote work remains prevalent. Many systems are not expecting to ever return to past volumes and have proactively sought new revenue streams to replace lost fares. Many transit systems have leveraged state and local taxes, and Moody’s recently reported that local tax revenues have nearly offset reduced fare revenue. We see this as indicative of the importance of transit systems to the underlying economy and the need to continue funding them.
Healthcare is slowly regaining its stride after years of working through a challenging operating environment. The largest headwinds impacting operating margins in recent years were staffing shortages, wage growth, and inflation’s impact on purchasing costs. While these factors are still present for most hospitals, most healthcare systems have been successfully adjusting their operations and, accordingly, have seen margin improvement. Per Moody’s, the median operating cash flow margin is now approaching 7%, a sustainable level that allows systems to invest in infrastructure while also strengthening their balance sheets.
1. Appleton’s Sector Outlooks are used as a general credit assessment tool that helps inform our investment process and communicate our perspectives to clients and partners. Issuer-specific research remains paramount, and individual bond issuers must be approved by our Credit Research team prior to purchase. As 2025 unfolds, our macro, sector and issuer views may change.
Composite Portfolio Positioning (As of 12/31/24)
Strategy Overview

Duration Exposure (as of 12/31/24)

The composites used to calculate strategy characteristics (“Characteristic Composites”) are subsets of the account groups used to calculate strategy performance (“Performance Composites”). Characteristic Composites excludes any account in the Performance Composite where cash exceeds 10% of the portfolio. Therefore, Characteristic Composites can be a smaller subset of accounts than Performance Composites. Inclusion of the additional accounts in the Characteristic Composites would likely alter the characteristics displayed above by the excess cash. Please contact us if you would like to see characteristics of Appleton’s Performance Composites.
Yield is a moment-in-time statistical metric for fixed income securities that helps investors determine the value of a security, portfolio or composite. YTW and YTM assume that the investor holds the bond to its call date or maturity. YTW and YTM are two of many factors that ultimately determine the rate of return of a bond or portfolio. Other factors include re-investment rate, whether the bond is held to maturity and whether the entity actually makes the coupon payments. Current Yield strictly measures a bond or portfolio’s cash flows and has no bearing on performance. For calculation purposes, Appleton uses an assumed cash yield which is updated on the last day of each quarter to match that of the Schwab Municipal Money Fund.
This commentary reflects the opinions of Appleton Partners based on information that we believe to be reliable. It is intended for informational purposes only, and not to suggest any specific performance or results, nor should it be considered investment, financial, tax or other professional advice. It is not an offer or solicitation. Views regarding the economy, securities markets or other specialized areas, like all predictors of future events, cannot be guaranteed to be accurate and may result in economic loss to the investor. While the Adviser believes the outside data sources cited to be credible, it has not independently verified the correctness of any of their inputs or calculations and, therefore, does not warranty the accuracy of any third-party sources or information. Any securities identified were selected for illustrative purposes only, as a vehicle for demonstrating investment analysis and decision making. Investment process, strategies, philosophies, allocations, performance composition, target characteristics and other parameters are current as of the date indicated and are subject to change without prior notice. Not all products listed are available on every platform and certain strategies may not be available to all investors. Financial professionals should contact their home offices. Registration with the SEC should not be construed as an endorsement or an indicator of investment skill acumen or experience. Investments and insurance products are not FDIC or any other government agency insured, are not bank guaranteed, and may lose value.


