


Insights and Observations
Economic, Public Policy, and Fed Developments
- The growing “peak inflation” market consensus crashed into the “stalling growth” call in May, after Walmart and Target reported earnings misses, citing margin compression from consumers substituting lower cost items. These announcements spooked the market, and the yield curve reacted by beginning to dial back rate hike expectations for the second half of the year.
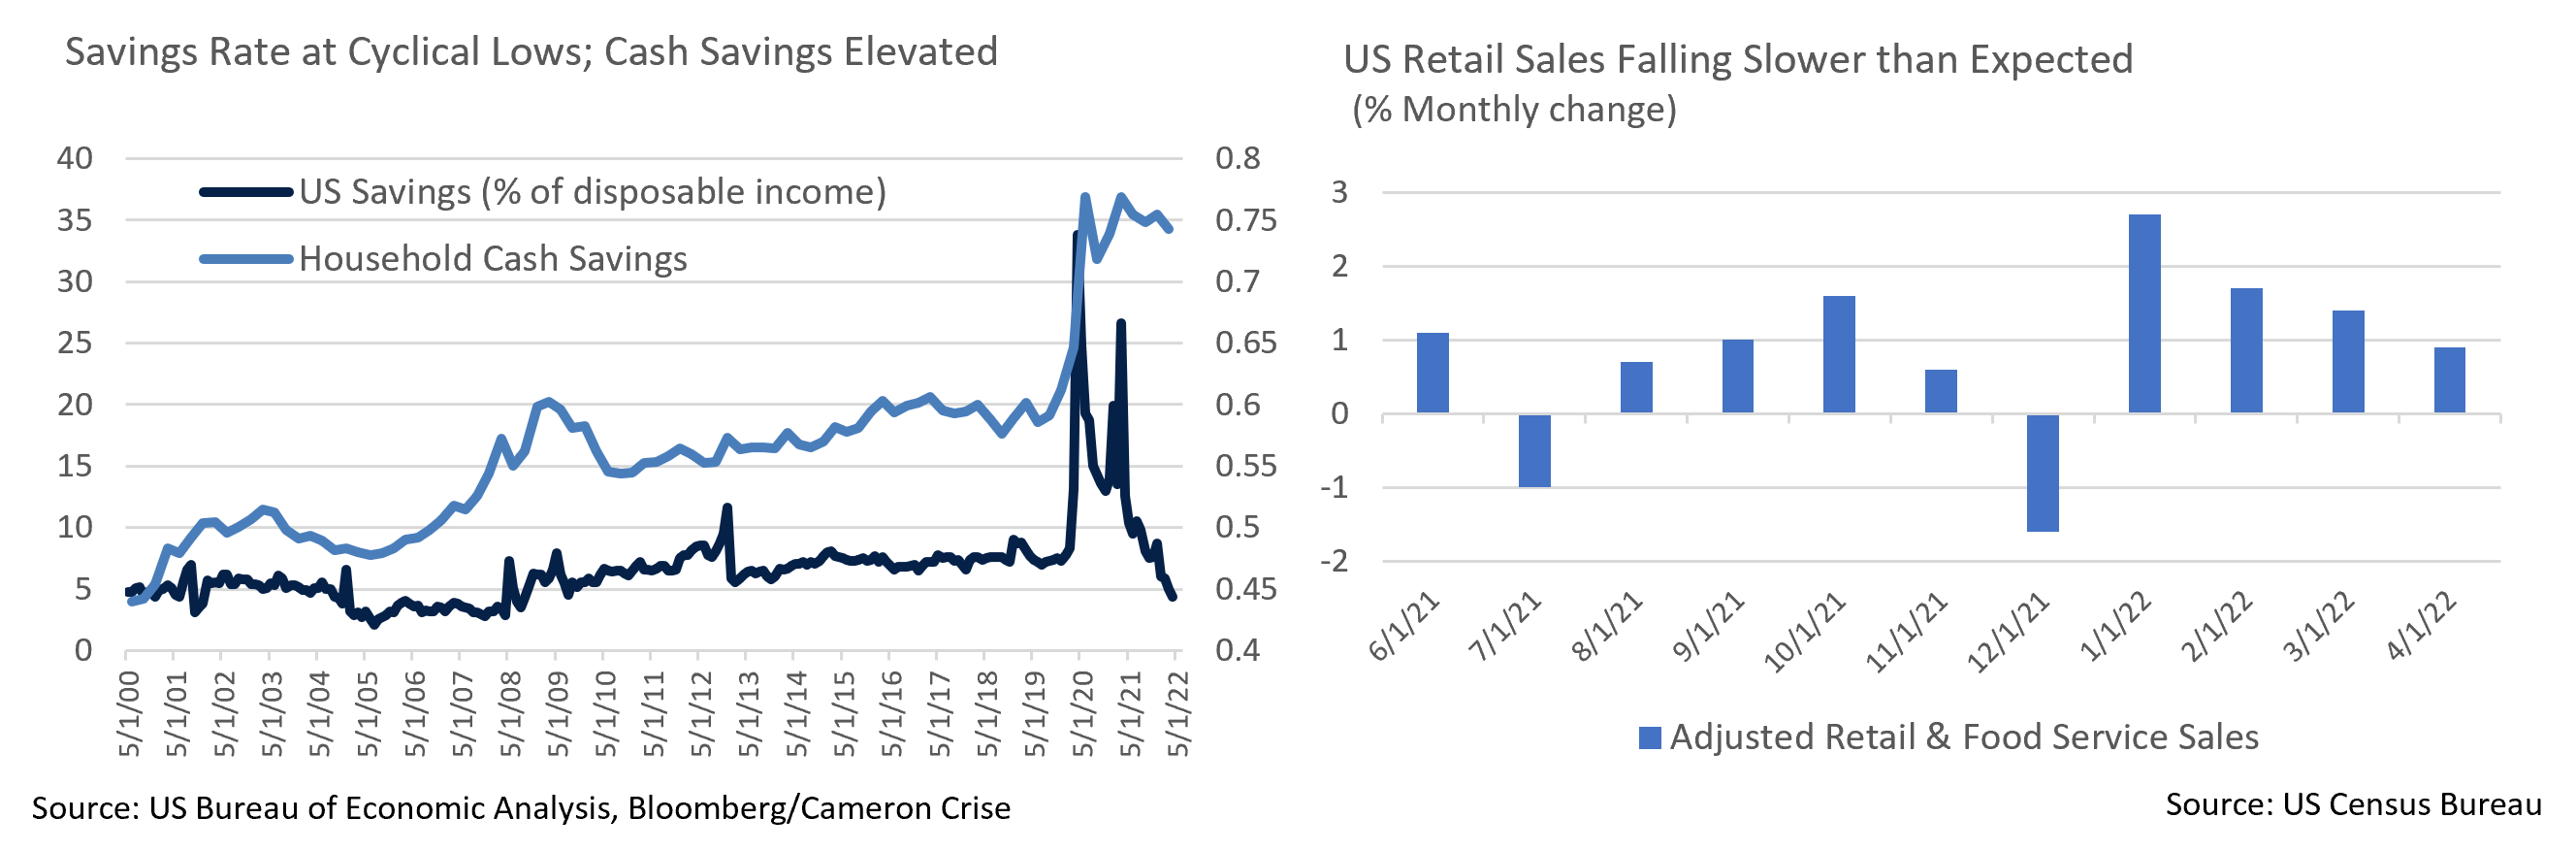
- Of note, aggregate retail sales have not actually slowed as much as these earnings reports suggest. The May headline growth rate fell short, +0.9% vs +1.0%, but March upwards revisions of +0.5% to +1.4% more than made up for the miss. Large revisions make it difficult to know how much trust to place in the data series, although consumers appear to still be spending despite falling inflation adjusted purchasing power.
- How this is being financed is another question. The savings rate fell to 4.4% in April, the lowest level since 2008, so the ability for consumers to spend out of current income is strained. Consumer total credit use rose by a record $52.4 billion with revolving credit up a record $31.4 billion over the month, suggesting that consumers may be turning to debt to finance spending. Household cash as % of GDP also remains abnormally high. While this is not broken out by income level, a large proportion is in checking accounts, which implies that low- and middle-income Americans (who tend to spend a greater proportion of their disposable income) may still be well capitalized. If cash holdings are a primary source of still-strong spending, the consumer may prove to be reasonably resilient.
- However, evidence of slowing growth was present in the Fed’s latest “beige book” survey of economic conditions. Most districts reported slight growth, with four reporting moderate growth, and four explicitly noting a slowdown since the last report. Labor remains a constraint, although coastal districts referenced possible hiring freezes in anticipation of growth slowdowns or other evidence of a softening in labor demand. There is little evidence yet in JOLTS (Job Openings and Labor Turnover survey) data, as openings remain just off record highs.
- On the inflation front, PPI and CPI both showed a deceleration in April though surprising to the upside. Headline inflation was impacted by a decline in gasoline prices that has since reversed. Worryingly, categories such as truck transportation show evidence of energy pass-through costs, indicating that a decline in inflation could be slow until gas prices fall. April PCE was in line with consensus and declined YoY from March, +5.4% to +4.9%, though headline may rise in May due to gas prices.
- OPEC+ provided encouraging news on this front at the start of June, unexpectedly doubling scheduled production increases. We caution that the increases are to be distributed pro-rata, and with some member states already at capacity and unable to meet their targets, actual increases may lag. Oil prices were mostly stable on the news. Nonetheless, this was an about face as for months the cartel had been saying more production was not the answer.
- May’s jobs report provided a degree of support to the Fed. While new jobs came in slightly higher than forecast, +390k vs. +318k, this was partially offset by modest downward revisions to prior periods, and the unemployment rate held steady at 3.6%. Average hourly earnings slowed as well, to +0.3% month-over-month. Overall, this report was consistent with other evidence that the Fed is making progress in their fight against inflation and leaves rate hike and quantitative tightening paths intact.
- As for Fed balance sheet reduction, the program began at the start of June although coupon payments will not occur before the 15th. With Treasury issuance expectations for the next several months falling relative to prior estimates, the excess supply the market will need to absorb should not be that burdensome.

From the Trading Desk
Municipal Markets
- The past month saw a dramatic and welcome tightening of municipal bid-ask spreads, as it appears investors recognized the relative value of the asset class and became more eager to put money to work. Recently elevated tax-exempt yields have significantly changed the Municipal/UST yield relationship with 10Yr ratios exceeding 100% at times during May before municipal outperformance towards the end of the month brought ratios back into a 90% range. Anecdotally, our trade desk has seen new issue deals many times oversubscribed and quality secondary offerings trading very quickly.
- Despite such demand, the retail channels have continued to lag, with 21 consecutive weeks of net outflows, although the pace has slowed. Lipper Inc. reports YTD net municipal fund outflows of $59 billion, a data point that highlights what is now the second largest outflow cycle since fund flows began being recorded in 1992. Nonetheless, Lipper reported positive inflows into High Yield funds over the week ending June 1st, a development of note given that high yield has often been a leading fund flow indicator.
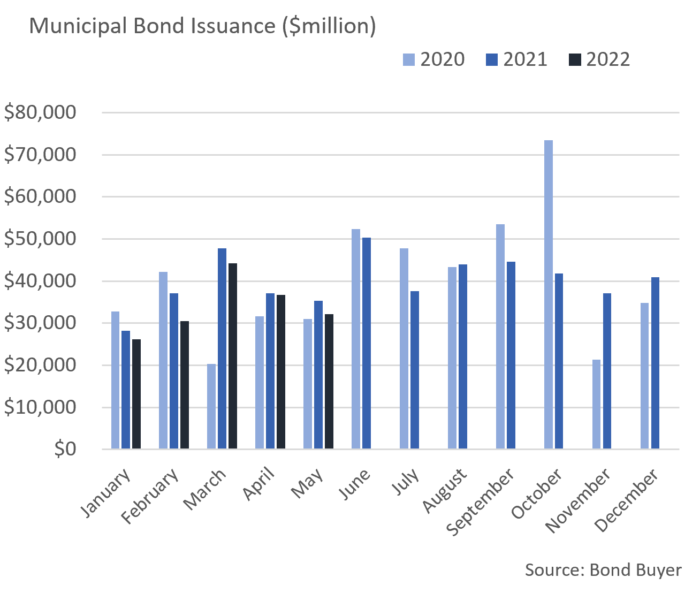
- According to The Bond Buyer, May issuance of $32.2 billion was about 9% lower than last May. YTD issuance of $169.7 billion also trails the prior by about 8.5%. Generally, lower net new market supply is supportive of municipal prices, although the recent slowdown in retail demand has played a meaningful role in this year’s softer technical dynamics. With net negative issuance expected over the summer months, and much higher yield levels in place than was the case in 2021, we anticipate late May’s firming in tax-exempt market pricing to be sustained.
Corporate Bond Markets
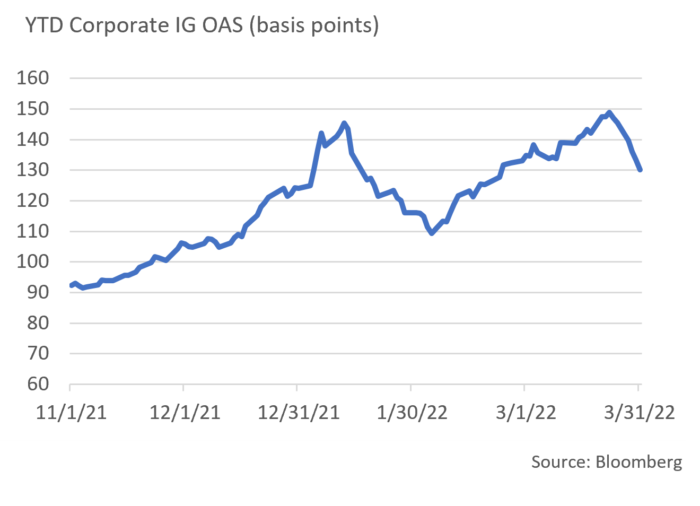
- Investment Grade credit spreads receded from YTD highs reached during the middle of May based largely on trading heavily influenced by technical factors. A lack of significant issuance to close out the second half of the month contributed to spread compression by hindering supply. Release of the Federal Reserve’s minutes on May 25th also had an influence, as a softer mood amongst Fed officials within a still hawkish message led to credit catching a bid. As these dynamics played out, the Bloomberg Barclays US Corporate Index saw OAS compress 13 bps to 130 bps after beginning the month at 143 bps.
- Despite fluctuation in investor sentiment and tightening financial conditions, corporate bond issuers that came to market towards the end of the month found strong investor reception to their deals and lower concessions than 2022’s overall average. That being said, $87 billion of new supply fell well short of $135 billion consensus expectations in May, despite issuance typically being heavy during that period. On a YTD basis, Investment Grade new issuance of roughly $645 billion is off 5% year-over-year, as equity market weakness and overall risk asset volatility are likely slowing the new issue calendar. Relative to credit spreads, this is a positive technical factor.
- The US Treasury curve was in a bear flattening mode most of the month with the front end rising significantly more than longer maturities. That was to be expected given the most recent rate hike. The 10Yr UST hit 3.12% (YTD high) at the close of the first week of May before subsequently dropping to 2.74% and closing the month at 2.84%. Our baseline estimate for the 10Yr UST over the remainder of the year lies in a range of 2.75% to 3.25%.
Public Sector Watch
Credit Comments
US Public Finance Sector Enjoys Favorable Ratings Performance
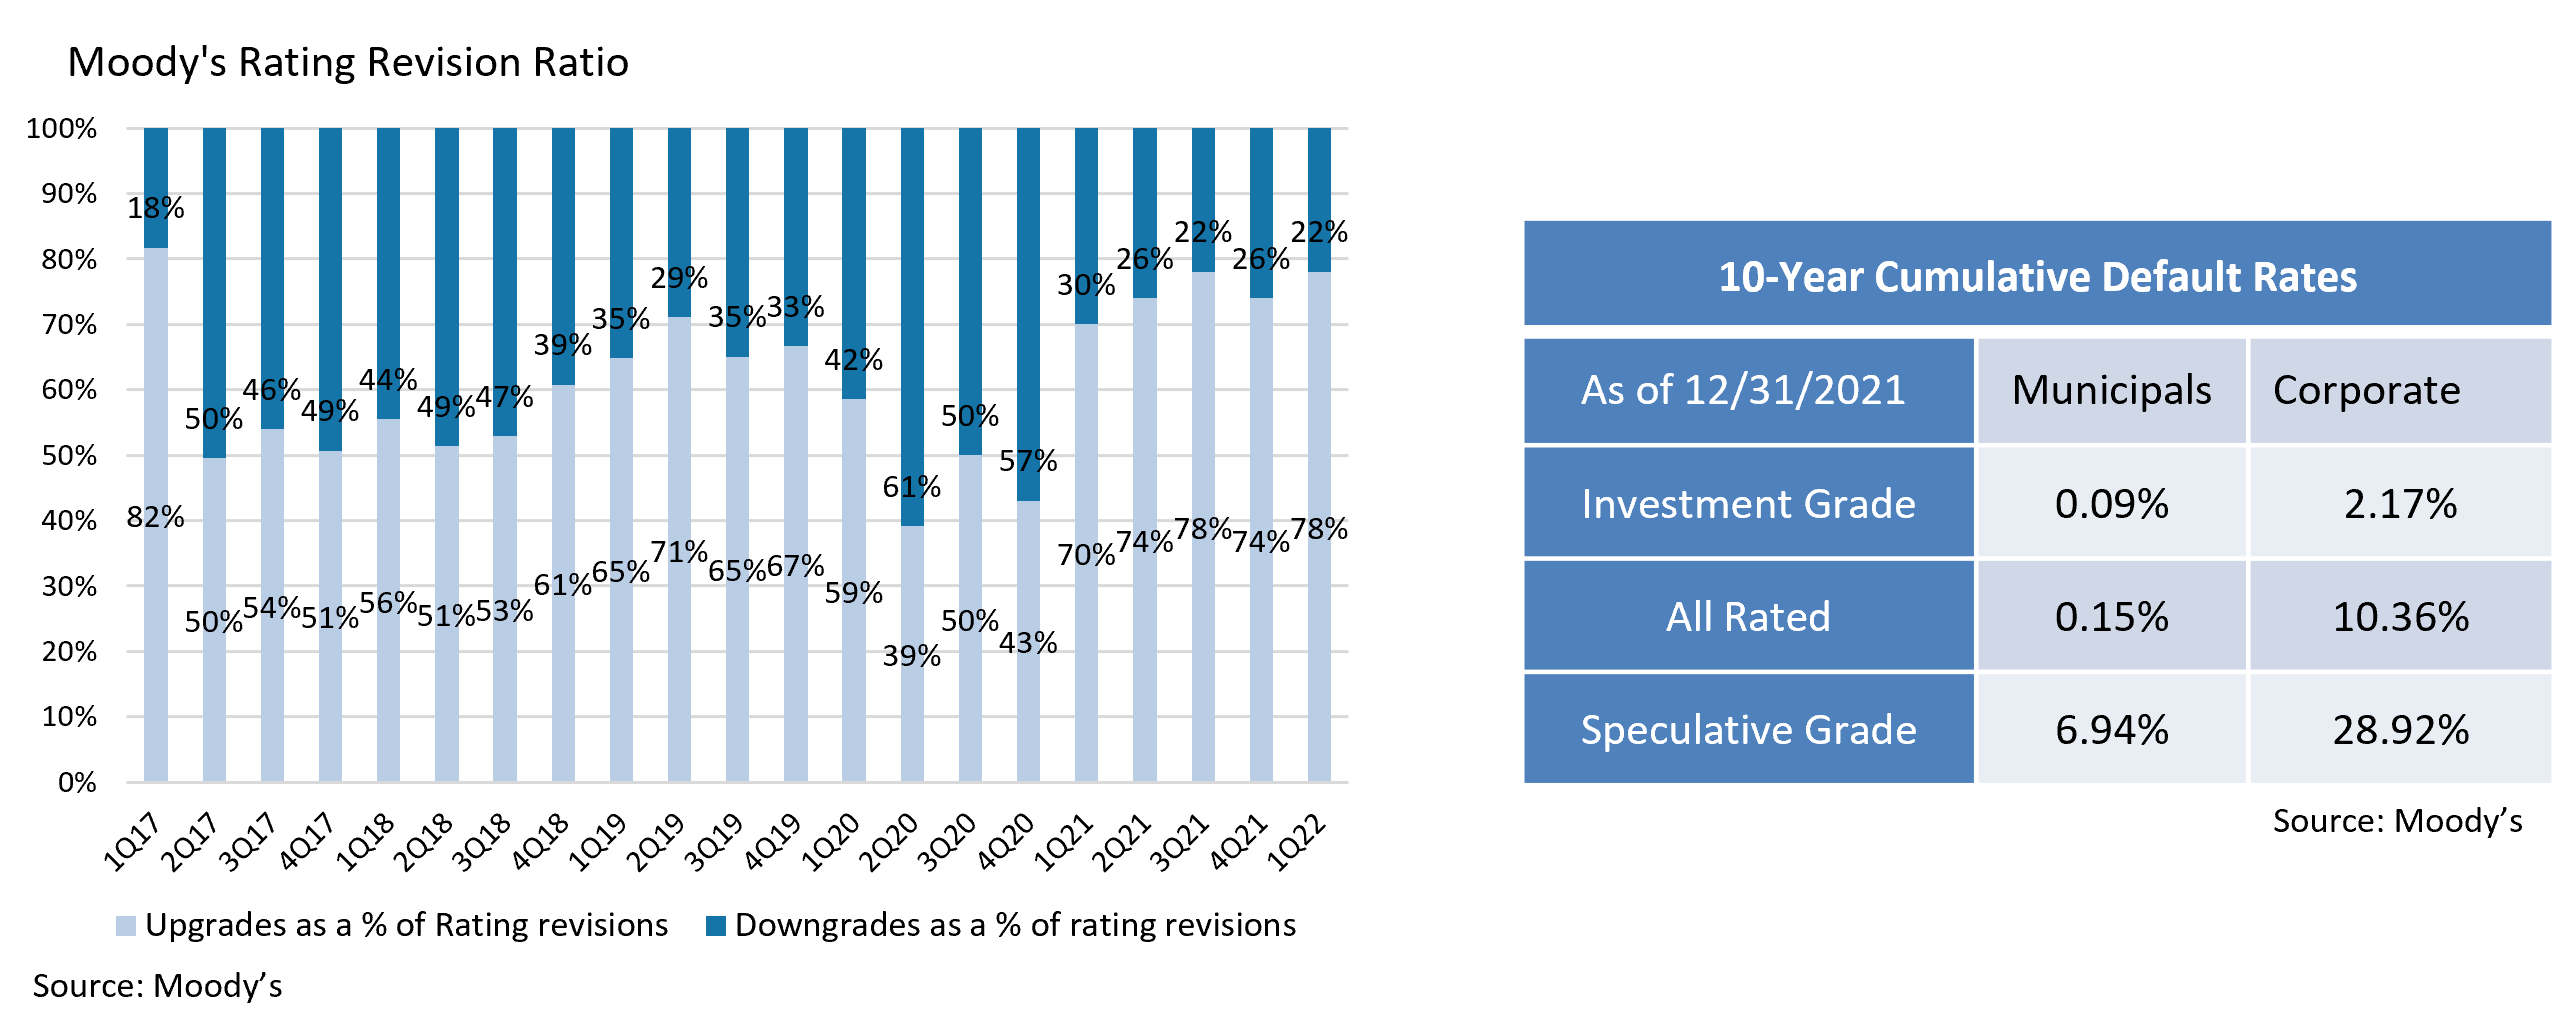
- Public finance obligors experienced positive credit rating changes in 2021, with upgrades outpacing downgrades at both Moody’s and S&P.
- A Rating Revision ratio of 2.8 upgrades to downgrades in 2021 stands in stark contrast to 2020 when S&P reported that the ratio reached a record low of 0.05 upgrades for every downgrade during Q2 and Q3 before quickly rebounding.
- Moody’s Rating Revision ratio followed a similar trend, with the proportion of upgrades to total rating revisions decreasing to 39% in Q2 ‘20, the lowest level since 3Q ‘14. The ratio remained low throughout 2020 before increasing to 70% in 1Q ‘21 and remained above this level during each quarter of 2021. The five-year average of upgrades relative to total rating revision ratio now stands at 61.3%.
- Positive Rating Revision ratios can largely be attributed to strong municipal issuer credit fundamentals resulting from revenue outperformance, receipt of significant Federal aid, and prudent budgeting.
- Notably, of the relatively small number of downgrades that S&P reported during 2021, about 88% were unrelated to the COVID-19 pandemic. The agency reported that positive and negative local government rating actions were largely related to issuer specific finances, followed by operations, and changes in the underlying economy.
- California serves as an example of very strong financial performance, with recent results far exceeding early pandemic projections. The State estimated in May 2020 that it was facing a $54 billion budget deficit through June 2021 based on a $41.2 billion drop in revenue and $13.1 billion of increased expenses.
Two short years later, in May of 2022, Gov. Newsom reported a record $97.5 billion operating surplus. Of that windfall, lawmakers can tap $49.2 billion for any purpose, affording the State significant operating flexibility. - State tax collections across the country are expected to remain on a positive growth trend throughout 2022, and Q1 2022 Revision Ratios continue to exceed downgrades by a sizeable margin.
- Strong credit fundamentals across the municipal market are also evidenced by Moody’s default study, which reported no new Moody’s rated defaults in 2021. Municipal defaults had ticked up in the aftermath of the Great Recession but have improved greatly since that time and are now lower than their historic averages. Municipal defaults remain incredibly rare, especially compared to the corporate debt market. Municipal bonds are also generally materially higher rated than corporates, with an average rating of Aa3 vs. Baa3.
- Defaults remain concentrated in isolated riskier sectors, led by Housing (39.5%) and Healthcare and Health Service providers (20.2%).It should be noted that Moody’s report only includes entities rated by the agency, therefore other sectors with higher default rates – charter schools, tobacco, and speculative projects for example– are not represented in this data. The data is also skewed by the fact that Moody’s rarely is asked to provide a rating for Senior Living deals, so the healthcare figure above is also lower than we would expect for the broader municipal market.
- While both the Rating Revision ratios and Moody’s default study point to robust credit fundamentals, interest rate volatility has caused spreads to widen modestly. We view this as an opportunity to explore relative value credit opportunities while maintaining our desired credit quality profile.
Strategy Overview
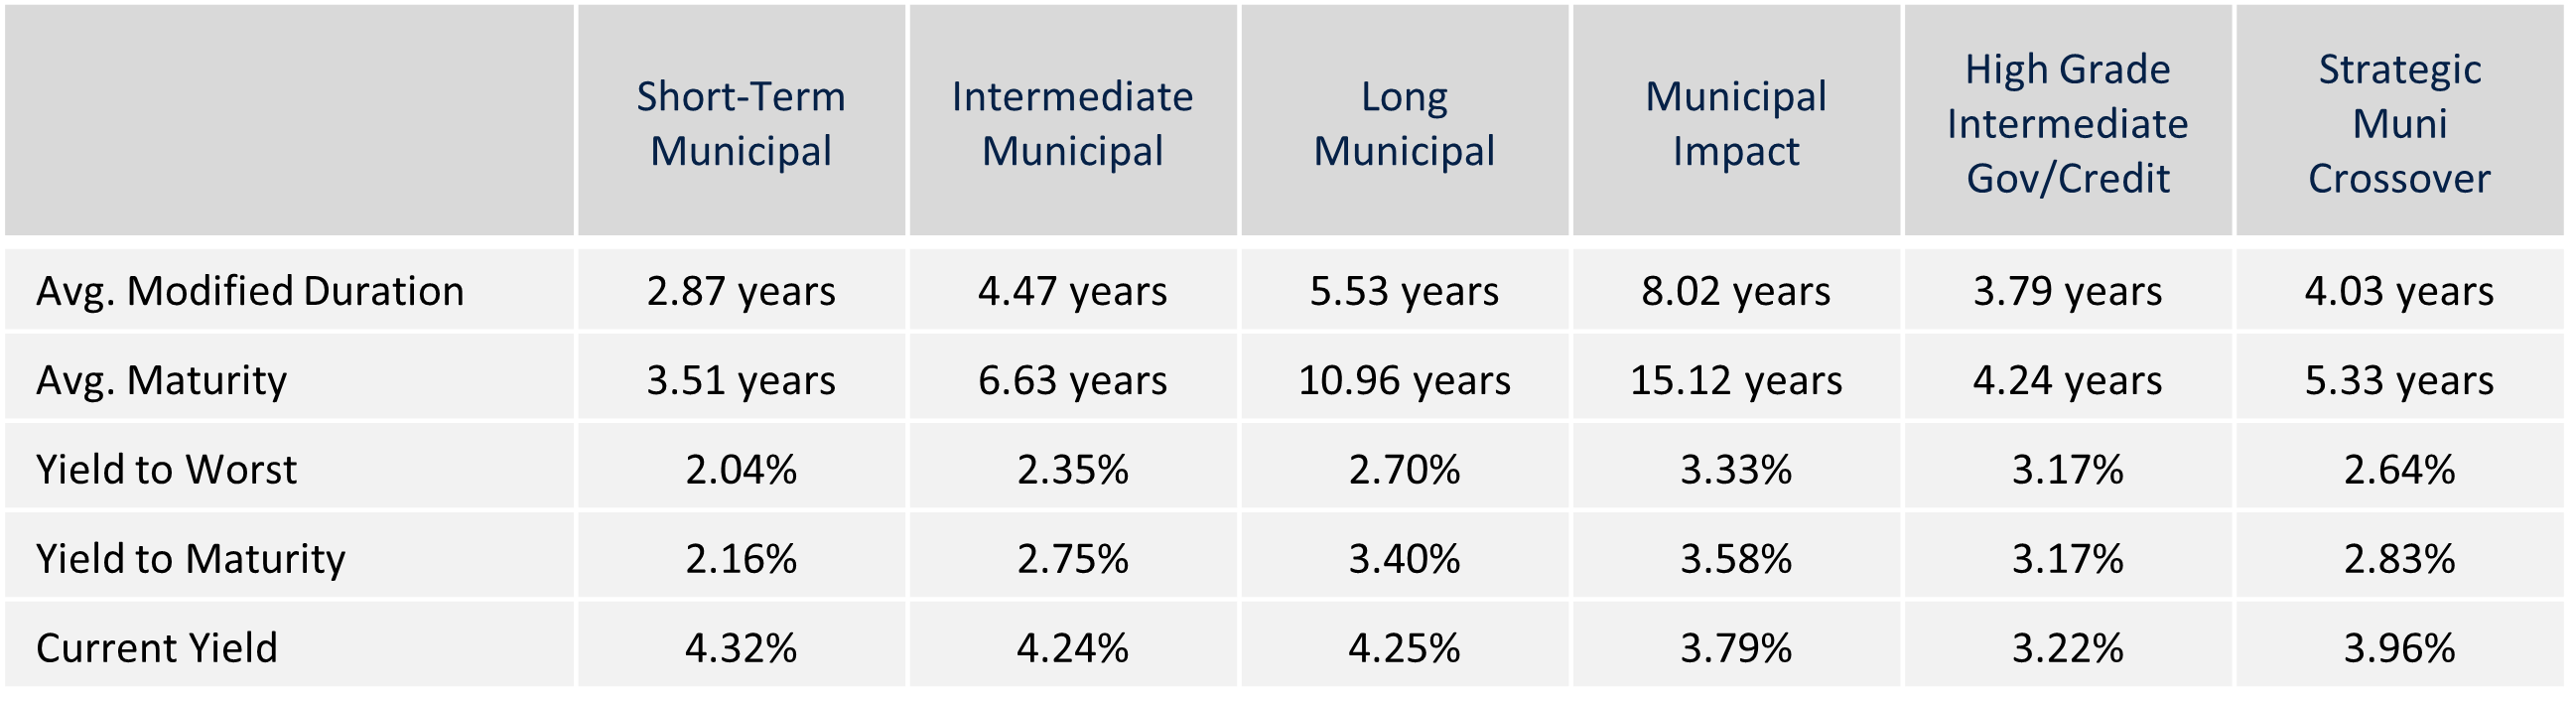
Composite Portfolio Positioning as of 5/31/22
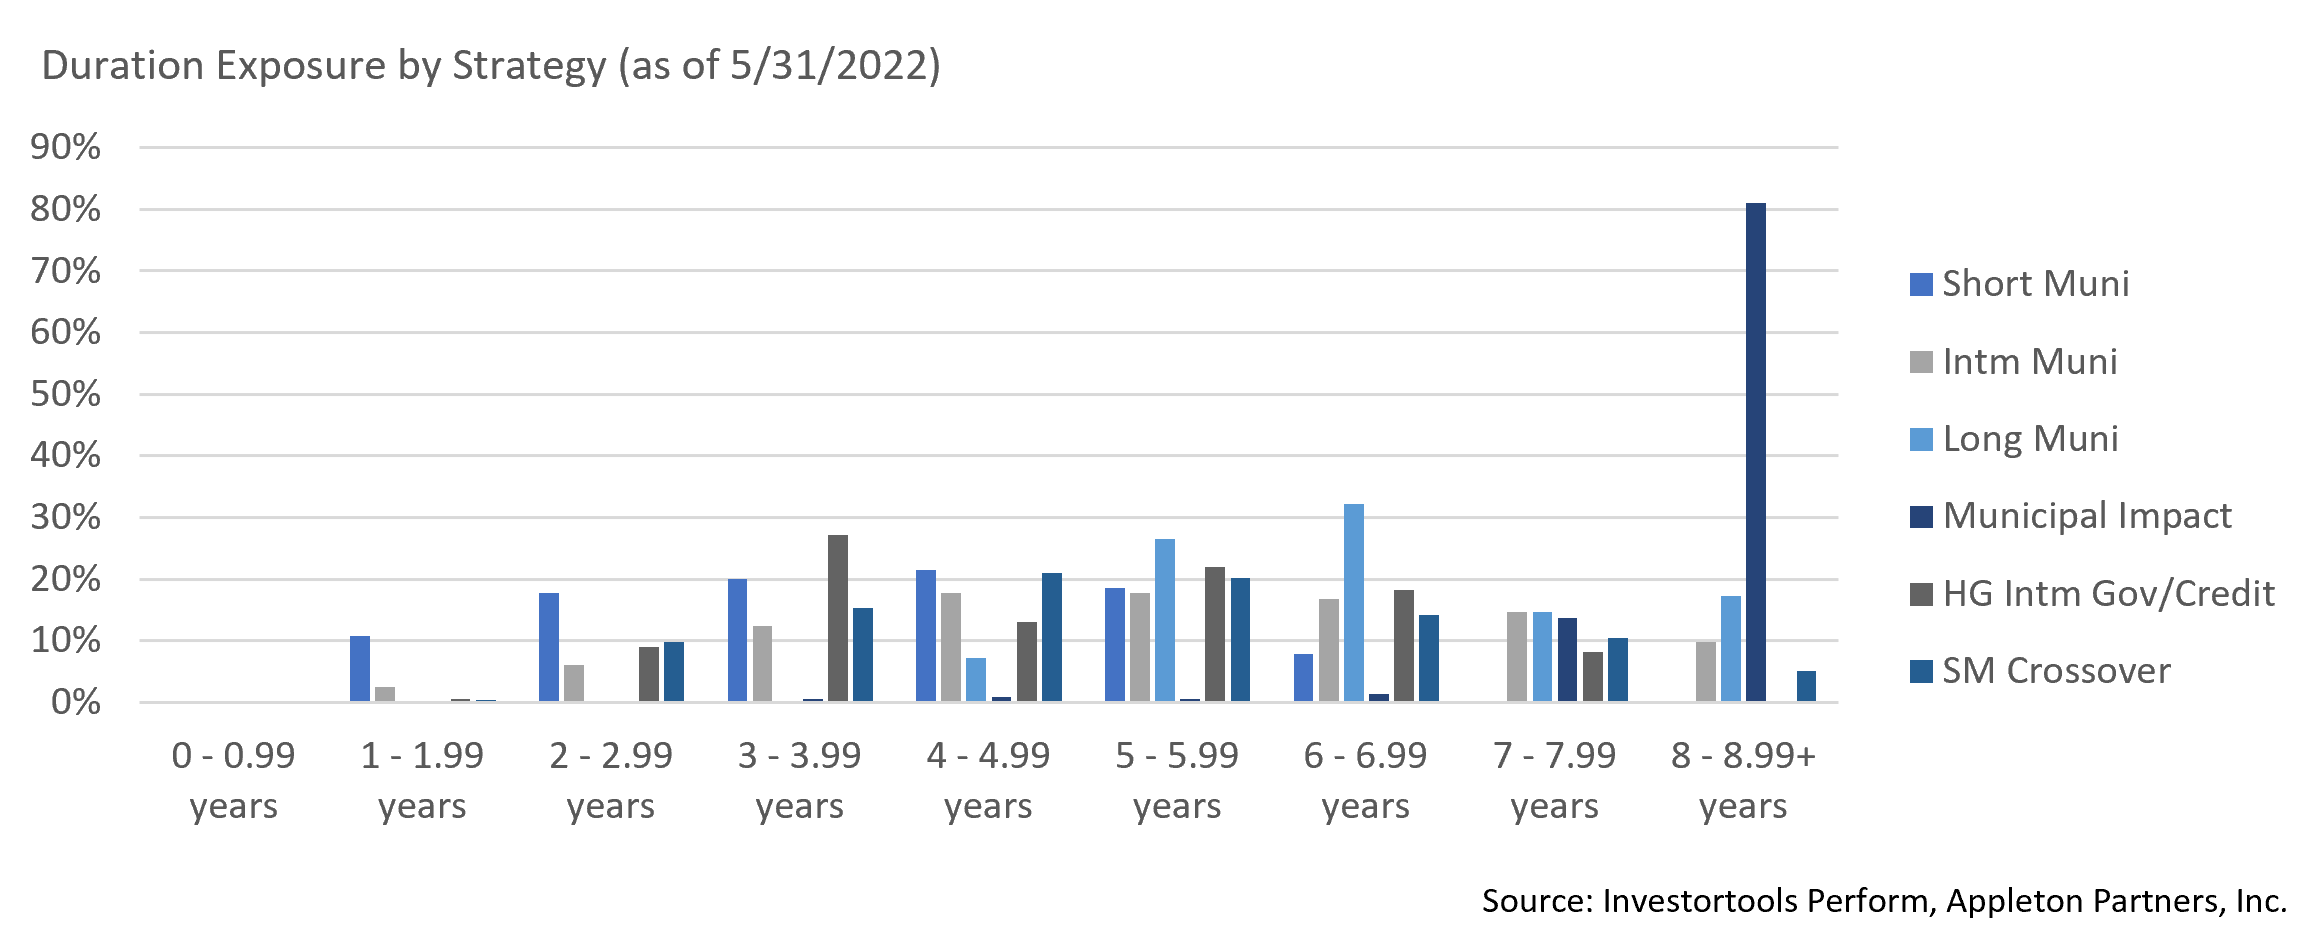
Duration Exposure by Strategy as of 5/31/22
Our Philosophy and Process
- Our objective is to preserve and grow your clients’ capital in a tax efficient manner.
- Dynamic active management and an emphasis on liquidity affords us the flexibility to react to changes in the credit, interest rate and yield curve environments.
- Dissecting the yield curve to target maturity exposure can help us capture value and capitalize on market inefficiencies as rate cycles change.
- Customized separate accounts are structured to meet your clients’ evolving tax, liquidity, risk tolerance and other unique needs.
- Intense credit research is applied within the liquid, high investment grade universe.
- Extensive fundamental, technical and economic analysis is utilized in making investment decisions.