


Insights & Observations
Economic, Public Policy, and Fed Developments
- While at the start of February, it was possible to tune out Washington and focus on fundamentals, by the beginning of March, that was no longer the case. There are a number of developing trends here we see as meaningful to investors.
- The first is that it’s increasingly clear DOGE is targeting a massive reduction in federal employment. The scale is still unclear, but between the voluntary severance package and the potential termination of probationary period employees, the upper end of plausible estimates now comfortably exceeds half a million workers. While it can be debated if a leaner government might better serve Americans, it is undeniable that half a million Americans losing their jobs in short order would be a risk to growth. A common rubric is that every federal job reduction yields two contractor reductions; the actual impact could be an order of magnitude larger.
- The “Sahm Rule,” that layoffs causing a 0.5% increase in unemployment lead to a recession, became a popular topic of discussion in late 2024. With a current US labor force of 170.7 million, 0.5% represents about 850,000 workers; this is a benchmark to keep in mind as the size and legal basis of federal job reductions comes into focus. Cuts approaching this level will significantly increase the likelihood of recession.
- Likewise, even after tariffs of 25% on Canada and Mexico and 20% on China went into effect on March 3rd, there is still great uncertainty around how tariff policy will evolve. Tariffs are complex and, depending on multiple factors, can either be inflationary and raise prices, or instead be price neutral and depress demand. During a period of fear of widespread layoffs, we would argue the latter is more likely. While this would bode well for the Fed’s crusade against inflation, it would do so for the wrong reasons: by depressing demand at a time when growth is weakening. This is an outcome the Fed hopes to avoid.
- Importantly, the degree of uncertainty around tariff policy and federal layoffs themselves has become a growth risk. It may matter less how many federal workers are laid off than how many federal workers change their spending habits for fear they might be, or the degree the threat of further trade barriers weighs on current market activity. We are already seeing evidence of this in economic releases.
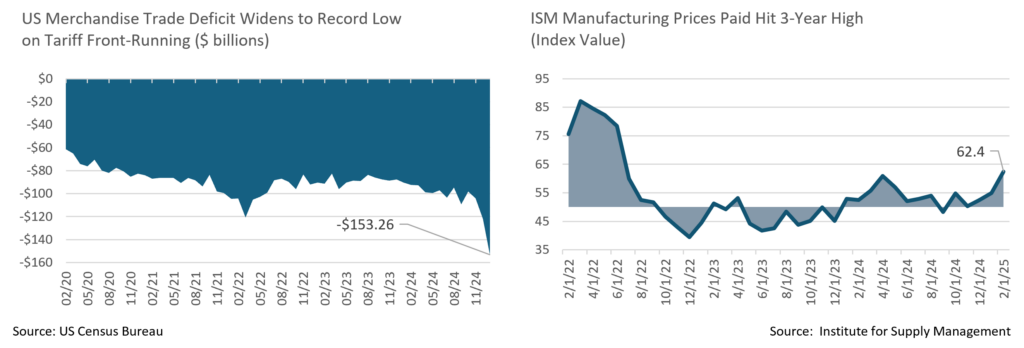
- The S&P US Services PMI unexpectedly dropped into contraction for the first time since January 2023, rattling markets and pulling longer yields down. Meanwhile, while the headline ISM Manufacturing remained slightly in expansion, employment and new orders both contracted, and the prices paid subcomponent surged to levels not seen since 2022. One factor likely explaining prices was that the largest US merchandise trade deficit on record occurred in January, broadly attributed to tariff front-running. In an uncertain environment, businesses appear to be positioning for tariffs and demand weakness just in case.
- We expected a hot January CPI and got one, with headline inflation rising +0.5%. PCE was more restrained, if too hot, and as at the start of 2024, our thesis was that seasonal factors would pull inflation up. Still, this will likely keep the Fed on hold until early summer.
- Meanwhile, two Congressional developments are worth watching in March: first, the House and Senate both passed legislation to begin the reconciliation process needed to extend the Tax Cuts and Jobs Act. Razor thin majorities and technical differences in policy cost calculations may complicate negotiations, however. Second, the government is now funded under a continuing resolution that expires on March 15th; this has yet to generate much attention, but a shutdown would likely be welcomed by DOGE and is a very real risk. Moody’s is the last credit agency to rate the US “Aaa,” though with a negative watch; an extended shutdown may prompt a downgrade.
Sources: St. Louis Fed, Institute of Supply Management, Standard & Poor’s, Moody’s, and Bureau of Labor Statistics
From the Trading Desk
Municipal Markets
- Over the month, municipal yields were lower across the curve, with the 2-Year AAA closing at 2.54%, 13bps lower than at the beginning of the month. The 10-Year was lower by 11bps at 2.86%. The spread between 2s and 10s widened slightly to 32bps, while the differential between 2s to 30s rose by 9bps to 139bps. While overall yields were lower, buyers should appreciate the steeper yield curve as it creates the opportunity to pick up value when adding duration.
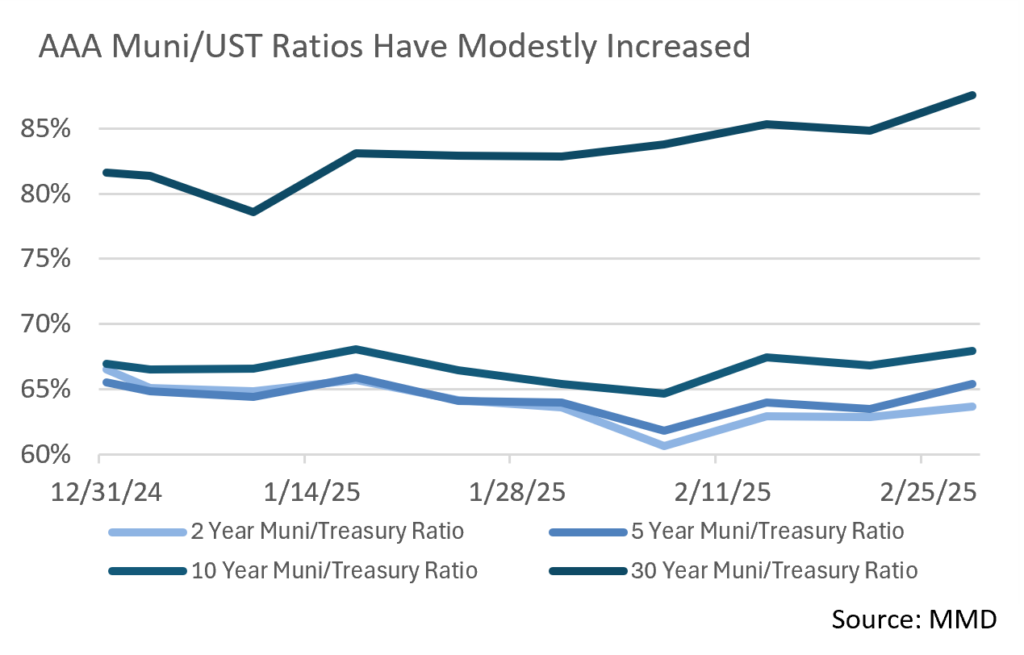
- Municipal values improved in February relative to USTs. On the 10-Year part of the AAA curve, municipals reached almost 68% of USTs, the relative value we have not seen in quite some time. The 2-Year, 5-Year, and 30-Year ratios also increased as municipals cheapened relative to USTs.
- At $33.8B, February issuance exceeded the prior year by a slim 2% margin, according to the Bond Buyer. Through the end of February, YTD issuance was 8.5% above the previous year. Given that 2024 issuance was elevated throughout the year, the strength of YTD new supply is notable. Strong levels of new tax-exempt bond offerings may be due to issuers bringing deals ahead of the threat of potential tax law changes. While we do not believe the municipal tax-exemption will be eliminated, there may be impacted market sectors.
- Looking forward to March, reinvestment capital of $30.5B is lower than both January and February, a dynamic that may dampen demand. Additionally, towards the end of March, investors tend to sell municipals to meet April tax bills. Against this selling pressure, the Bond Buyer reports 30-day visible supply of $15B, the highest level since January 14th. The combination of heightened supply and potentially muted demand could create an imbalance that pressures municipal prices over the near term.
Corporate Markets
- A drop in rates throughout the month of February made the new issuance backdrop attractive for issuers as overall funding cost has dropped to a YTD low. The final week of March saw $51B of new debt hitting the market, which significantly beat market expectations of $30B and brought the MTD volume up to $161B. So far, 2025 issuance is trailing 2024 levels when compared to the same longer-term, but the Month of March is expected to bring roughly $190B. That could prove to be higher and may signal a robust market going forward due to bonds issued in COVID era of 2020 now maturing. There is approximately $135B in maturities coming due in the month of March, leaving only net issuance of $50B if estimates come to fruition. The resurgence of M&A activity funding had certainly contributed to overall volume, which has easily been absorbed by heightened demand.
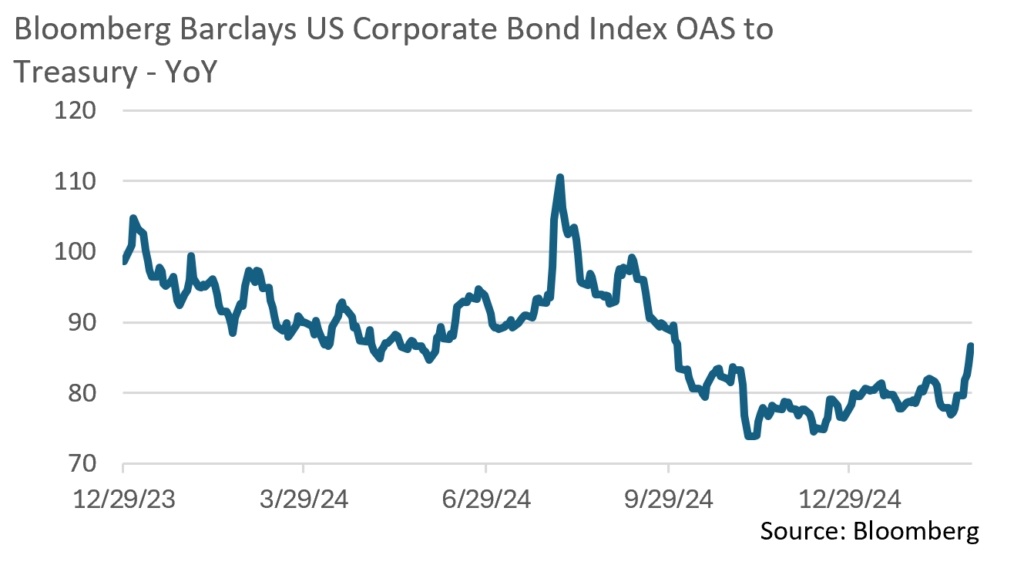
- The fight to quality trade, in reaction to the large amount of economic and political uncertainty, has contributed to spreads widening to levels not seen since October 2024. Spread movement in the month of February was a roller coaster ride as spreads slid to a YTD low 77bps OAS on the Bloomberg US Corporate IG index to a YTD high 87 bps to close out the month. While this move is the largest since August 2023, the backdrop and technicals remain stable. Demand due to COVID era bonds coming due will keep demand high. There may be some slack in the market prior to the FOMC decision in the middle of March, but post Fed, demand for bonds should be positive for spreads remaining in the current range.
- The front-end trough of the UST curve deepened over the course of February as longer-term bonds dipped lower, driving a Bull Flattening trend throughout the month. Maturities inside of 1yr remained stable as maturities of 3yrs or more fell by 25 – 30bps. To open the month, the 2-10yr spread was 34 basis points, but the 33bps move lower in the 10yr yield to 4.20% was more than the move in the 2yr.
- The volume of economic indicators in addition to Fed speak in March is likely to keep the market on its toes, and it seems that the continuation of market volatility will be apparent. We take comfort in the strength of credit fundamentals in the corporates we own and are seeking relative value across the high-grade taxable markets as conditions change.
Source: MMD, Bloomberg
Public Sector Watch
Federally Induced Policy Drama Raises Credit Uncertainty
It’s been a whirlwind of late, and we are monitoring the myriad of executive orders and policy proposals coming out of D.C., as well as the potential impact on municipal credit conditions. Given the volume of actual or threatened actions over the first two months of the second Trump Administration, every municipal market sector could be impacted in some way. However, the range of possibilities remains very wide, and implementation of changes is likely to be significantly different than proposed, with many proposals already in legal limbo. So, what’s to make of today’s turbulent times?
Given a distinct lack of clarity on the policy front, it is impossible to state with certainty how specific regions, sectors, or issuers will be affected. What we can say is that after years of strong tax revenues and conservative budgeting, municipal credit fundamentals are entering this turbulent period in a strong position. Municipalities benefit from their service essentiality, an attribute that offers a degree of pricing power and demand inelasticity. This also leads to budgetary flexibility, including the ability of many to manage necessary expense reductions and/or revenue increases.
We remind our readers that 33 states raised taxes or fees in the depths of the Great Financial Crisis (2009-2010), and over the last 40 years, there have been only four years in which cumulative state revenues declined (National Association of State Budget Officers). Although some municipal issuers will be more impacted than others, we believe municipal fundamentals will largely remain strong absent a severe economic recession.
We retain even greater confidence in how Appleton-managed municipal bond portfolios are positioned. Our longstanding focus on large, well-run municipalities should soften the credit impact of future policy changes. Larger issuers are not immune to Fed policy changes, although revenue diversity, financial flexibility, experienced management teams, and strong access to external liquidity all provide support during times of fiscal stress. Hallmarks of our investment process – issuer and sector diversity, frequent and diligent research analysis, and active portfolio management – offer additional risk mitigation tools.
Our investment team is staying attuned to developments at the Federal level, evaluating their potential economic and municipal market influence. We are also remaining proactive about making portfolio adjustments if we feel they are warranted and beneficial to our clients.
Municipal Upgrades Outpace Downgrades
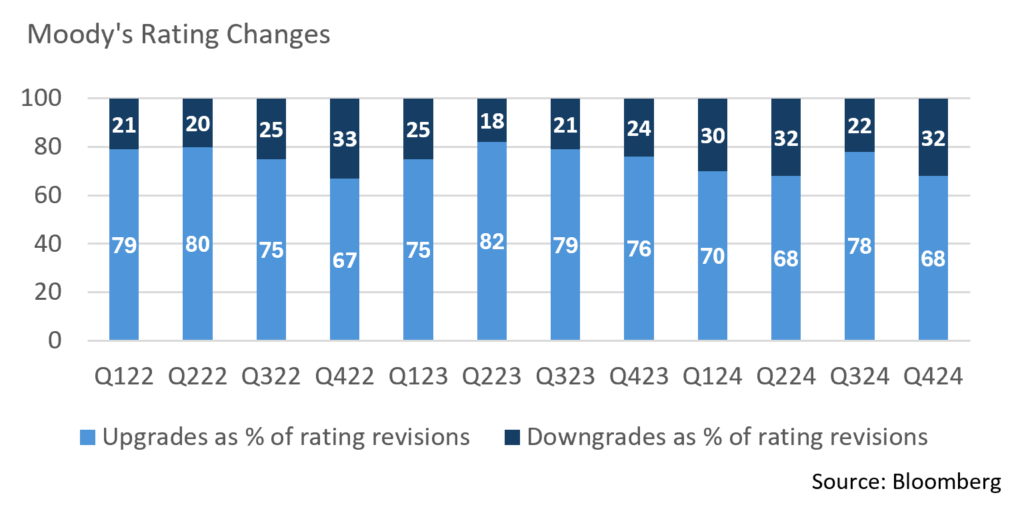
- S&P and Moody’s recently published their 2024 upgrade to downgrade ratio, reporting a total of 1,516 upgrades while downgrading 764, a healthy 2 to 1 ratio. This exceeds long-term historical averages, although it is down from the prior year’s ratio of 4.1 to 1.
- Moody’s stated that the upgrade trend reflects a favorable economic landscape marked by low unemployment, strong tax base growth from home value appreciation and steady economic expansion, coupled with sustained financial strength.
- Moody’s also reported that not-for-profit healthcare and the higher education sectors have had less favorable trends with an annual upgrade to downgrade ratio of only 0.46 (14 upgrades and 30 downgrades) for the healthcare sector and 0.23 (9 upgrades and 40 downgrades) for the higher education sector. Both sectors are experiencing high labor costs and capital expenses along with limited revenue growth.
- Moody’s also published rating changes by debt outstanding for each credit. When accounting for the par value of upgrades to downgrades, $529.2B of total debt was upgraded in 2024, while $127.6B of debt was downgraded, a robust ratio of 4.2. This is, to a considerable extent, indicative of large, diverse, municipalities with ample resources and more debt outstanding being upgraded, while smaller municipalities with fewer resources were more likely to be downgraded. The nature of this credit dynamic supports Appleton’s preference for investing in large, well-known names.
Sources: Standard & Poor’s, Moody’s, Bloomberg, National Association of State Budget Officers
Composite Portfolio Positioning (As of 2/28/25)
Strategy Overview
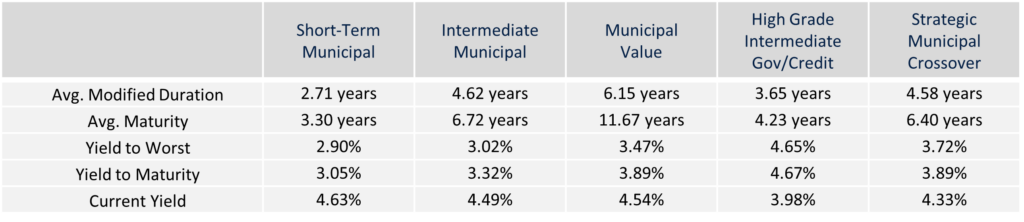
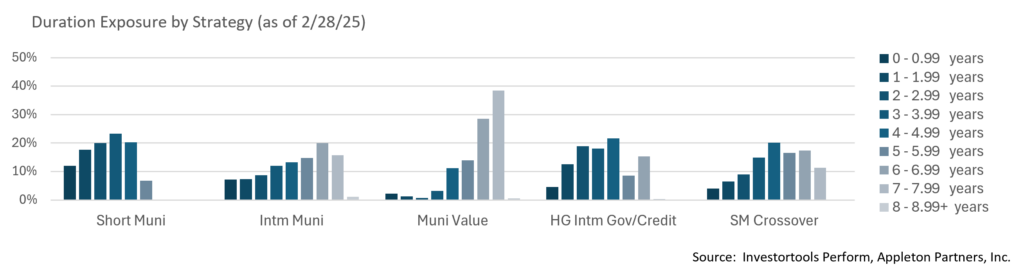
Duration Exposure (as of 2/28/25)
The composites used to calculate strategy characteristics (“Characteristic Composites”) are subsets of the account groups used to calculate strategy performance (“Performance Composites”). Characteristic Composites excludes any account in the Performance Composite where cash exceeds 10% of the portfolio. Therefore, Characteristic Composites can be a smaller subset of accounts than Performance Composites. Inclusion of the additional accounts in the Characteristic Composites would likely alter the characteristics displayed above by the excess cash. Please contact us if you would like to see characteristics of Appleton’s Performance Composites.
Yield is a moment-in-time statistical metric for fixed income securities that helps investors determine the value of a security, portfolio or composite. YTW and YTM assume that the investor holds the bond to its call date or maturity. YTW and YTM are two of many factors that ultimately determine the rate of return of a bond or portfolio. Other factors include re-investment rate, whether the bond is held to maturity and whether the entity actually makes the coupon payments. Current Yield strictly measures a bond or portfolio’s cash flows and has no bearing on performance. For calculation purposes, Appleton uses an assumed cash yield which is updated on the last day of each quarter to match that of the Schwab Municipal Money Fund.
This commentary reflects the opinions of Appleton Partners based on information that we believe to be reliable. It is intended for informational purposes only, and not to suggest any specific performance or results, nor should it be considered investment, financial, tax or other professional advice. It is not an offer or solicitation. Views regarding the economy, securities markets or other specialized areas, like all predictors of future events, cannot be guaranteed to be accurate and may result in economic loss to the investor. While the Adviser believes the outside data sources cited to be credible, it has not independently verified the correctness of any of their inputs or calculations and, therefore, does not warranty the accuracy of any third-party sources or information. Any securities identified were selected for illustrative purposes only, as a vehicle for demonstrating investment analysis and decision making. Investment process, strategies, philosophies, allocations, performance composition, target characteristics and other parameters are current as of the date indicated and are subject to change without prior notice. Not all products listed are available on every platform and certain strategies may not be available to all investors. Financial professionals should contact their home offices. Registration with the SEC should not be construed as an endorsement or an indicator of investment skill acumen or experience. Investments and insurance products are not FDIC or any other government agency insured, are not bank guaranteed, and may lose value.