


Insights and Observations
Economic, Public Policy, and Fed Developments
- No winner was declared in the US Presidential Election on Tuesday night, and it will take time before votes have been fully counted. While it’s too soon to make solid prognostications on the economic impacts of this election, we can take several outcomes off the table. At present, the betting markets consider Biden likely to prevail, though the “blue wave” the Democrats had hoped for failed to materialize. The House will remain Democratic, but the Senate is likely to remain under Republican control, though a razor-thin Democratic majority is not impossible. Either a Republican Senate or a thin Democratic one, however, would make passing a sweeping Democratic agenda extremely challenging over the next two years, and more immediately, the likelihood of a second stimulus bill has fallen considerably. Despite the uncertain outcome, lower probability of stimulus, and possibility of legal challenges, however, the markets initially reacted quite favorably.
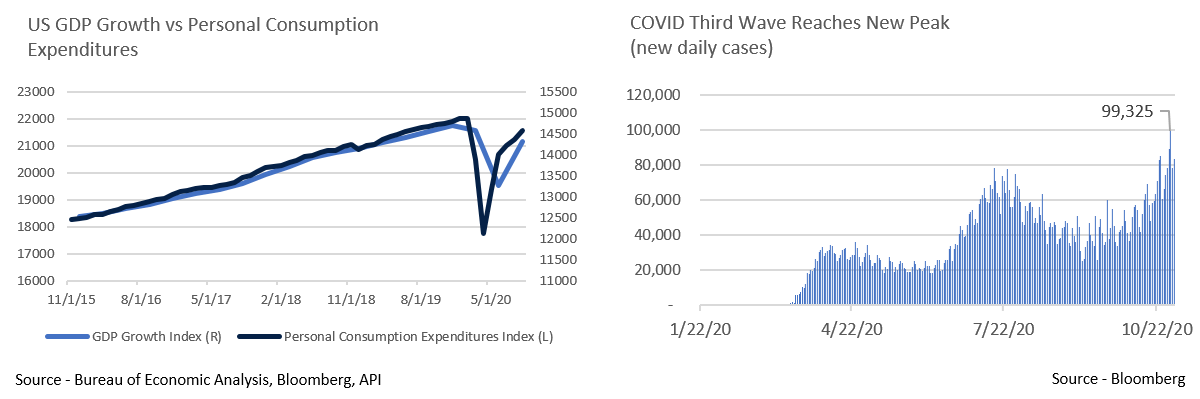
- The Q3 GDP report was another record setter, though this time in the opposite direction – GDP grew at an annualized rate of 33.1% (quarterly rate of 7.4%), an all-time high, exceeding expectations for growth of 32%. Growth was driven by a heavy rebound in durable goods consumption of 82.2%, contributing to overall consumption growth of 40.7%. Federal, state, and local government spending was a drag, contracting -4.5%, as state and local governments tightened their belts as receipts fell and CARES Act stimulus began to expire. While these were strong results, evidence suggests growth began to slow later in the quarter, and with GDP still 3.5% below pre-pandemic levels (equivalent to 15.1% annualized) it will still be some time before growth fully recovers. Millions more Americans also remain out of work than in February.
- Similarly, while personal income growth was a better-than-expected +0.9% and September retail sales represented a surprisingly bright economic data point, up 1.9% vs. expectations of 0.8%, income was largely propped up by the $300 “Lost Wages Supplemental Payments” authorized by President Trump after the expiration of CARES Act benefits. These payments were of a smaller dollar amount but offered a wider pool of eligibility, although they have now begun to expire, suggesting personal income is very likely to contract in October’s report. Consumption, particularly of durable goods, has been a source of strength in the recovery, and any erosion of consumer spending power could jeopardize that.
- The Fed’s Beige Book contained few surprises but provided some color while mostly confirming what we already knew about the economy. All districts reported “slight to modest” growth, though with extreme variability from sector to sector. The survey reported demand for goods was far higher than services, with demand for cars – an alternative to public transport – high, while dining out weakened as the weather cooled. Manufacturing and warehouse jobs grew while service sector employment weakened. Rural tourism – likely long-term relocation as people work from home – has been booming, while urban areas displayed continued economic weakness. There were also widespread reports of workers leaving the labor force, citing public health concerns or family obligations, echoing a decline in the participation rate in BLS releases. Overall, much of this was not new and aligns with our expectations of how the economy is responding to a global pandemic, although the Beige Book release provides a wealth of anecdotal support to flesh out data releases.
- The COVID-19 pandemic worsened materially during October, breaking 90,000 daily new cases for the first time at month-end. Daily and weekly new case totals are now higher than at any previous point, although thus far cities and states have been restrained in putting restrictions back in place. Public health officials are generally expecting the pandemic’s current wave to peak in November, with the pandemic deepening over the next several weeks.

From the Trading Desk
Municipal Markets
- The municipal yield curve flattened modestly to close the month as the spread between 2 and 10 years declined to 72 bps. Despite slight flattening, we continue to see value in the 6 to 9-year portion of the curve where there is some relative steepness.
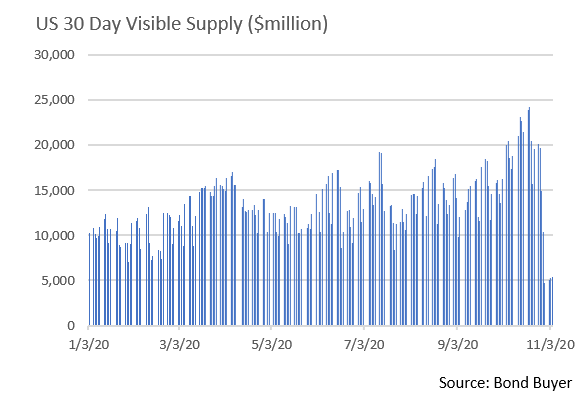
- Issuance – or lack thereof – is a factor we are adjusting to as we enter November.After a sizeable $17B came to market over the week of October 26th, the first week of November is expected to be much lower. The Bond Buyer’s 30-day visible supply of about $5B follows a record $71B of October issuance, a month to which many issuers pulled their deals forward. Citi expects only $17B for all of November as the election and Thanksgiving break will likely diminish new supply, making it more challenging to put cash to work.
- Looking at Citi’s numbers, while total municipal issuance is up 42% YTD ($450B vs. $316B at this time last year), nearly all the increase has come to market through taxable offerings (+437% YTD). Traditional tax-exempt issuance is largely flat. We see sustained taxable supply in Q4 and likely into 2021 given low interest rates and an inability to advance refund tax-exempt debt.
- Municipal demand remains strong with mutual funds gathering a net $582M in October, cash flow that leaves YTD net inflows at $25.6B, an impressive figure given the dramatic short-term outflows of March and early April.
Corporate Bond Markets
- As has been well advertised, there has been no shortage of Investment Grade Corporate issuance in 2020 with borrowing costs near all-time lows. October brought over $80B of new debt (largest October since 2012), bringing the YTD total to a record setting $1.662 trillion.
- Despite this surge in new supply, plenty of investors are lining up to buy. The Federal Reserve’s backstop remains a positive for corporate credit, as is sustained retail and institutional demand. Investment Grade Corporate bond mutual funds alone brought in another $3.3B of net assets during the last week of Q3.
- Over the last six months we have also seen a shift in foreign buying patterns, as overseas investors are moving out of non-US sovereigns and into the Euro and US Investment Grade credit markets given more attractive relative value and the impact low nominal yields have had on reducing foreign currency hedging costs.
- The OAS on the Bloomberg Barclays US Corporate Bond index ended the month at 125 bps, 10 bps lower than where it began. Large foreign insurance companies and banks are announcing plans for additional buying of US Investment Grade credit which should continue to be supportive of spreads.
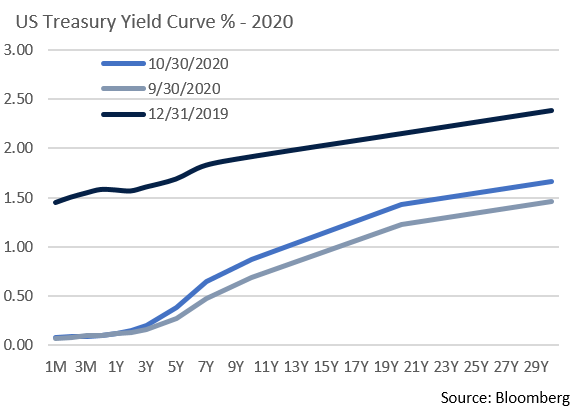
- While the front end of the UST curve remains anchored, longer dated yields climbed higher on the month keeping the bear steepening trend intact. The spread between 2Yr and 10Yr USTs closed the month at 71 bps, the highest level since February 2018. By contrast, the spread between 2Yr and 5Yr USTs is just 22 bps as the bulk of the steepness remains between 5 and 10 years. The longer part of the UST curve (10s, 20s, and 30s) climbed in unison by roughly 20 bps in October, sending what we feel is a healthy forward economic signal.
- The Federal Reserve’s meeting was pushed back a day to Wednesday, November 4th on account of the still unresolved election. Our expectation is that further stimulus measures will await final election results, although Chairman Powell may leave the door open to adjusting Fed bond purchases at a later meeting, perhaps as soon as December. Their accommodative stance should remain intact and nothing dramatic is likely to come from this meeting.
Public Sector Watch
Credit Comments
A Look at State Ballot Measures
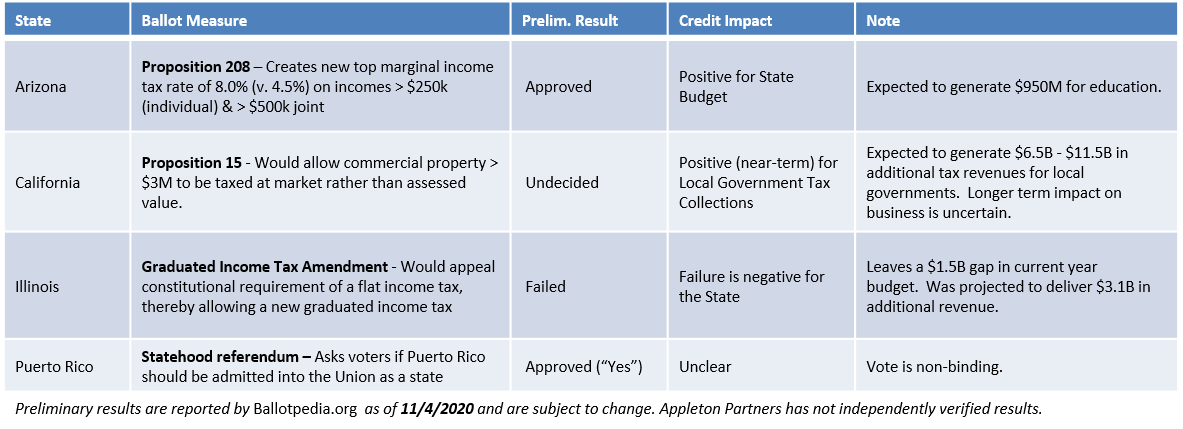
- While not receiving top billing in the media, 128 measures were on the ballot at the state and local level in the Nov. 3rd election. These measures can have an important impact on state and local credit trends, as voter support (or lack thereof) can alter tax collection trends and/or spending mandates. Below we present key measures and preliminary results:
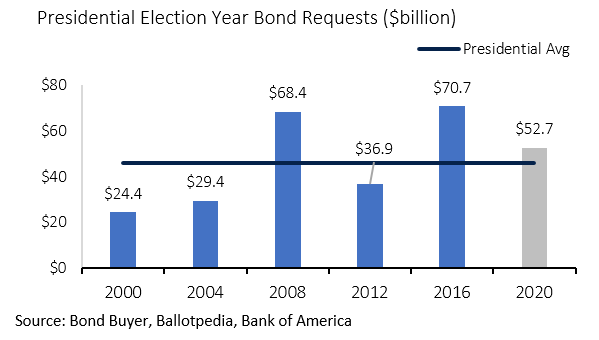
Bond Authorizations Reflect Modest Levels of New Borrowing
- Bond authorization approvals can be an indicator of future municipal issuance trends. This year’s slate of requests and their early approval point to a willingness of municipalities to invest in their communities and voter support for essential projects.
- State and local governments requested $52.7B of bond authorizations on the ballot, according to Bank of America. Although this is $17.9B less than 2016’s election, it is slightly larger than the average of $46.0B for the last five presidential elections.
- We anticipate a high percentage of requests will be approved, although at this time results are still being tabulated. Since 2000, voters have approved 81.7% of bond authorizations sought in presidential election years. This compares to 80.3% in midterm election years and 77.2% in off-year elections.
Pensions:
- The coronavirus pandemic has had a severe impact on state and local governments’ underlying credit fundamentals and did not spare pension liabilities. While many budgetary items are largely expected to show resiliency, pension liabilities will likely continue to deteriorate without remediation.
- While investment returns vary widely, most governments posted low single digit investment returns in FY20. This will cause pension costs to increase, although the current impact on a funding and cash basis will not be extreme due to asset smoothing and amortization techniques. Funding impact will also not be evident until the 2022 budget due to the lagged funding mechanism.
- Government’s balance sheets will bear the brunt of increased liabilities though, particularly if future investment returns lag. With interest rates at historically low levels, states are being forced to adjust their targeted returns below a typical 7% range, thereby causing balance sheet liabilities to spike.
- Despite modifying expected returns, many governments are arguably still being too optimistic. Moody’s currently uses a discount rate of 2.70% for FY20. Applying this much lower rate would result in total aggregate adjusted net pension liabilities for states of $1.7 trillion compared to a reported liability of $716.6B. Lower rates must be compensated by higher contributions, a credit factor that must be considered.
- Positively, we have seen a much greater inclination to maintain pension funding levels than was the case during the Great Recession of 2008-2009.
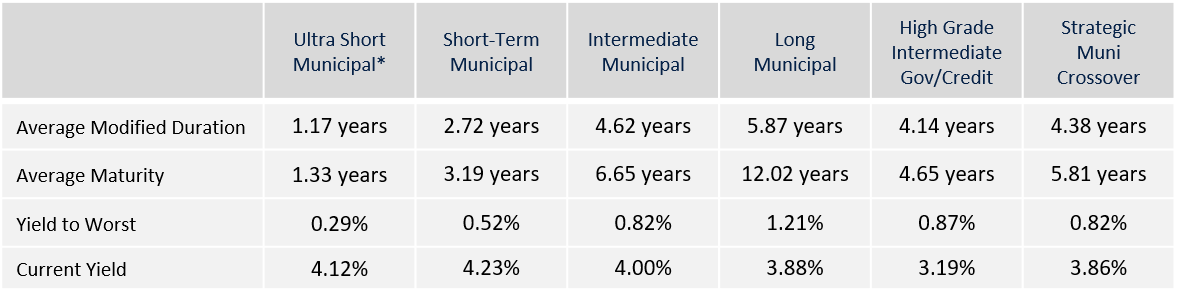
Strategy Overview
Composite Portfolio Positioning as of 10/31/20
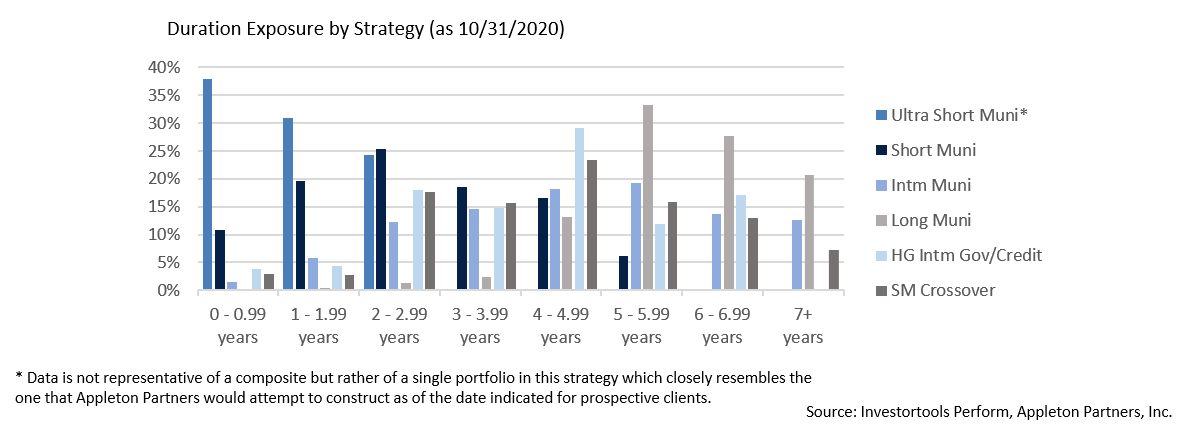
Duration Exposure by Strategy as of 10/31/20
Our Philosophy and Process
- Our objective is to preserve and grow your clients’ capital in a tax efficient manner.
- Dynamic active management and an emphasis on liquidity affords us the flexibility to react to changes in the credit, interest rate and yield curve environments.
- Dissecting the yield curve to target maturity exposure can help us capture value and capitalize on market inefficiencies as rate cycles change.
- Customized separate accounts are structured to meet your clients’ evolving tax, liquidity, risk tolerance and other unique needs.
- Intense credit research is applied within the liquid, high investment grade universe.
- Extensive fundamental, technical and economic analysis is utilized in making investment decisions.