


Insights and Observations
Economic, Public Policy, and Fed Developments
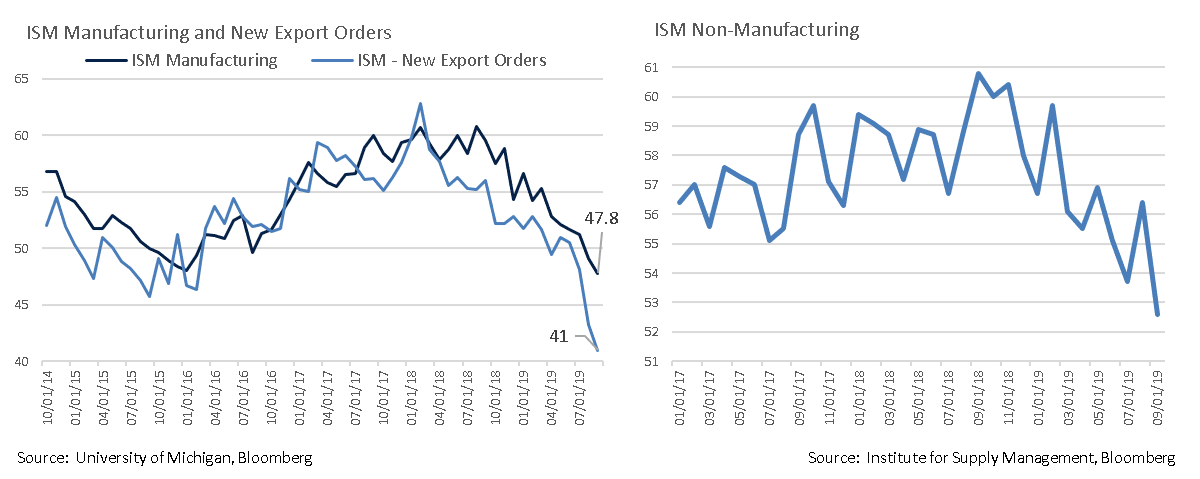
- September saw Treasury rates whipsaw with most of August’s steep decline reversing by mid-month on the back of a not as bad as expected ISM Non-Manufacturing report and trade talk optimism. This lasted until the September 14th attack on Saudi oil fields, a troubling event followed by an evaporation of liquidity in the repo markets several days later. These developments ignited a risk-off sentiment and a reversal in yields. The 10Yr UST ultimately closed the quarter up 18 bps to 1.68%, well off the mid-month high of 1.90%. We considered the spike in Treasury yields in the first half of the month to be reactionary; trade news has been unreliable for some time, and while the Non-Manufacturing Index beat comfortably in August, it was still the fourth weakest reading in the trailing 12 months and a continuation of a downtrend that was confirmed by September’s miss.Regardless, the market has become increasingly skittish and we expect volatility to remain high.
- In trade news, not much of substance changed other than confirmation that high-level talks would occur in October. The Chinese committed to resume soybean and pork purchases. Although the media perceived positive implications from the news, China is facing a swine flu epidemic that is pushing up pork prices nearly everywhere but the US, making this less of a goodwill gesture than it appears at first glance. Even without major new developments, there is growing evidence that trade is weighing on the US economy.
- Moody’s Analytics released a report in September estimating the trade war has already cost the US about 300,000 jobs, a number they believe could reach 450,000 by year-end and 900,000 by 2020 if the current course holds. Further, the ISM Manufacturing report hit 10-year lows in September. The abysmal report evidenced further contraction in US manufacturing – a very nominal portion of the economy but still considered an important leading indicator – as well as a pronounced drop in new export orders, very likely impacted by the slowdown in global trade. The WTO now only expects merchandise trade volume growth of 1.9% in 2019, down from an estimate of 2.6% before the late summer trade war escalation.
- Headline August retail sales were reasonably strong at 0.4% vs 0.2% consensus, though this was largely due to a +1.8% contribution from the auto sector; ex-autos sales were flat. This weakness may represent a substitution effect, with consumers dialing back routine purchasing while still making a big-ticket purchase. However, given that manufacturer-reported auto sales have been sluggish thus far in September, a strong ex-auto retail number would be necessary to support this thesis. Meanwhile, consumer confidence unexpectedly declined in August, dropping to 125.1 from 134.2. While these levels are still high, further degradation would be concerning.
- Political risk reached fever pitch in late September, when a whistleblower scandal alleging Trump had pressured Ukraine to investigate his 2016 and 2020 political rivals while withholding military aid and White House access led the House to formally open impeachment investigations. On the same day, UK courts called Parliament back to session, ruling Boris Johnson’s shutdown was unconstitutional. We view the latter as a modest positive as it decreases the odds of a no-deal Brexit. The former, for the time being, should have minimal market impact; Congress is already gridlocked, and at present the odds of an impeachment ending in Senate conviction are low. Nonetheless, political news is likely to dominate headlines for some time, even if market impact is muted.
From the Trading Desk
Municipal Markets
- As has been the case nearly all year, municipal technicals remain very strong. Retail demand continues to drive the market with YTD net mutual fund inflows of $69 billion maintaining a record pace. This has more than offset 8% and 9% YOY declines in bank and P&C insurance company holdings.
- On the supply side, net negative issuance has limited market inventory. JP Morgan is estimating $81 billion of net negative issuance in 2019, and the overall municipal market declined in size by 1.5% through mid-year.
- A combination of sustained demand, constrained supply, and solid credit fundamentals has compressed yields and supported strong municipal performance. Through September 30th, the Bloomberg Barclays Municipal Bond Index has returned 6.75%.
- Weakening global economic expectations contributed to a recent further flattening of the municipal yield curve. Over the course of Q3, AAA 2-10 Year muni spreads fell by 18 bps, while the front end, measured by 1-7 year spreads, barely moved (+1 bp).
- A flat front-end of the muni yield curve coupled with a very low rate environment has prompted many client inquiries. We feel Variable Rate Demand Notes (VRDNs) warrant consideration as a potential short-term, high quality option. SIFMA, a tax-exempt proxy for VRDN yields, ended September at 1.49%. For those looking to put cash to work on a temporary basis, or simply wishing to hold liquid, high quality assets, ultra-short accounts with an ability to tactically allocate between VRDNs and short munis as relative value changes may have appeal.
Taxable Markets
- There were no rates surprises from the Federal Reserve this month as its well telegraphed 25 bps rate cut was largely a non-event. The range of the Fed Funds target is now 1.75% – 2.00% and the effective rate is 1.88%. The FOMC also reduced its interest rate on required and excess reserves (IOER/IORR) by 30 bps to 1.80%, roughly in line with Fed Funds.
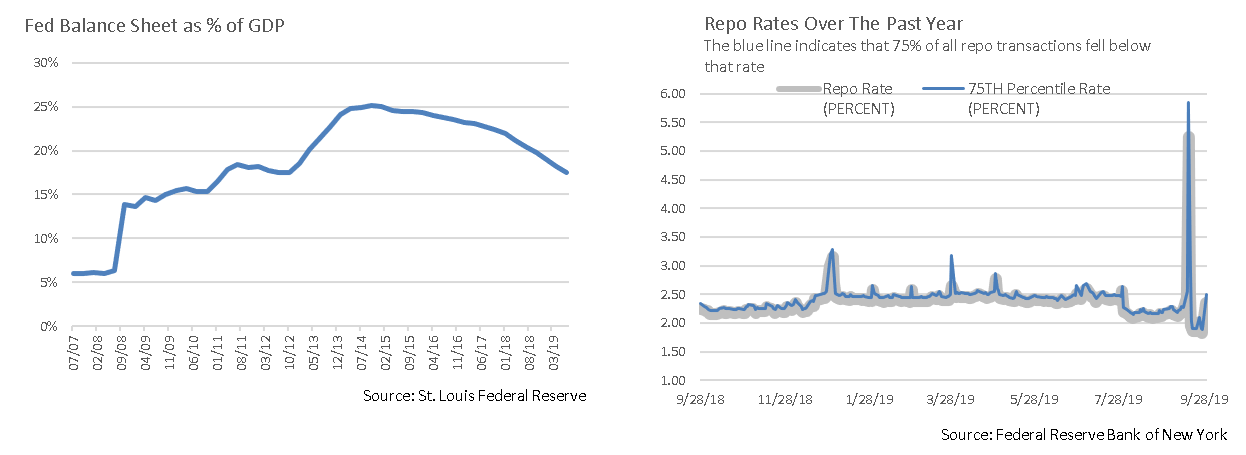
- A notable concern did materialize in September, as banks’ needs for short-term cash began to outweigh cash available to borrow, creating a potentially significant liquidity problem in the repo markets. Banks and other institutions use assets as collateral to fund short-term needs such as tax payments and trading activity. Typically, banks borrow and loan from each other through overnight repo contracts and when cash is not readily available they go to the Fed window. This time around several factors compromised the banking system’s ability to efficiently loan cash, momentarily driving repo costs at certain points in time as high as 9%, creating a need for sustained Fed intervention.
- A contributing factor was the Fed’s sharp reduction in buying activity (i.e. cash infusion) due to a previously communicated objective of reducing its swollen post-Financial Crisis balance sheet.“Accounting 101” emphasizes that Fed assets (Government securities) and Fed liabilities (cash) must “balance out.” In order to lend more cash, thereby alleviating the repo liquidity crunch banks temporarily faced, the Fed must take in more assets and once again grow their balance sheet. That’s exactly what’s been happening, with the Fed recently injecting upwards of $50 billion a day. This intervention has calmed matters by creating the liquidity needed to maintain orderly markets. We are not overly concerned and have not seen material impact to credit conditions, although a return to more permanent and routine interbank funding would be welcome.
Public Sector Watch
Credit Comments
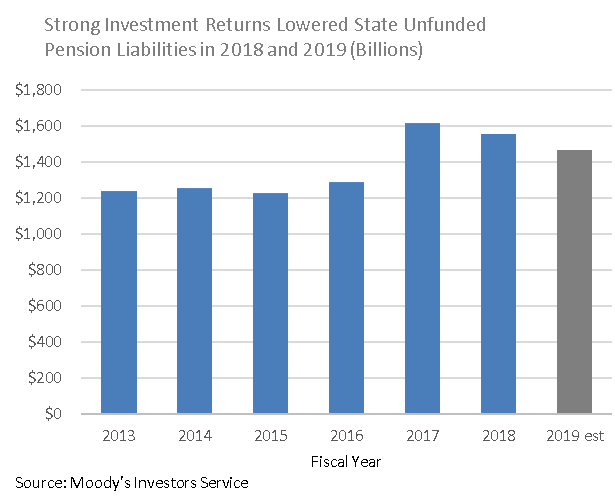
Investment Performance, Revenue Growth Improve State Pension Affordability
- Cumulative unfunded state pension liabilities declined 3.6% in fiscal 2018 to $1.56 trillion according to Moody’s data, due largely to strong investment performance realized in 2017. Reported returns for fiscal 2018 were also strong, suggesting that we’ll see another year of improved funding when updated data is released.
- States have also experienced robust tax revenue growth over the last two fiscal years, supported by sustained economic growth, tax changes and increased discretionary income. Improved top-line figures provide states with greater resources to pay down long-term liabilities, such as debt, pensions and other post-employment benefits, thereby potentially enhancing their credit profile. Median fixed costs for states have declined accordingly in 2018, with another reduction likely when 2019 numbers are reported. Increased budgetary flexibility bodes well for most states, particularly as this may help mitigate economic uncertainty as the current expansion ages.
- Most states are experiencing stable-to-improving credit conditions, leading us to maintain exposure to the sector while still avoiding those that have failed to improve pension affordability and/or repair their balance sheets.
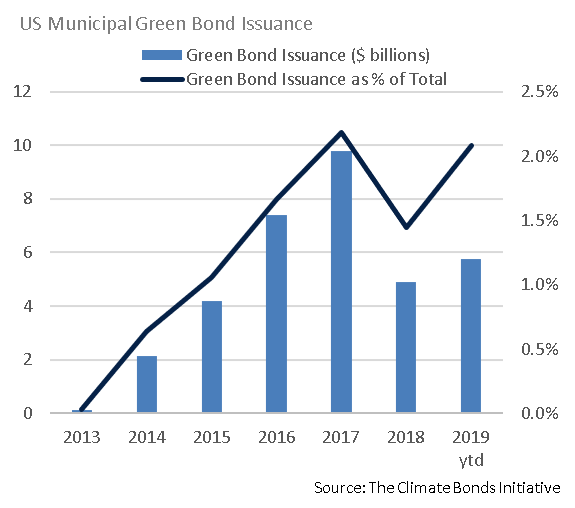
Muni Green Bond Market Update
- The first municipal Green Bond was sold by our home state of Massachusetts in 2013. These are bonds for which the issuer commits to using all proceeds for environmentally friendly purposes such as renewable energy, clean transportation, sustainable water management, or climate change adaptations. Since Massachusetts broke new ground more than $30 billion has been issued. However, even as the market matured, the “Green” label remains a largely unregulated and voluntary designation. This is vastly different than the corporate and global markets and leaves individual investors in the municipal Green Bond market with little to rely on, heightening the need for professional management of these securities.
- While overall municipal issuance was down in 2018, Green Bonds’ share of new issuance fell at a greater rate. Although the Green Bond market has bounced back in 2019, issuance will likely end the year lower than 2016 and 2017.
- We believe that a broader focus on ESG values across the municipal markets is superseding some of the demand for more narrowly-defined Green Bonds. Issuers and bankers are likely to adapt accordingly by structuring bond marketing and project descriptions to meet burgeoning demand. However, we don’t expect the underlying fundamentals of the municipal market to change all that much. A large portion of the high-grade market already arguably exhibits ESG qualities given the need to provide essential and sustainable services to their constituents. We incorporate assessment of ESG-related risks into our proprietary research and they remain important to our credit analysis and portfolio construction.
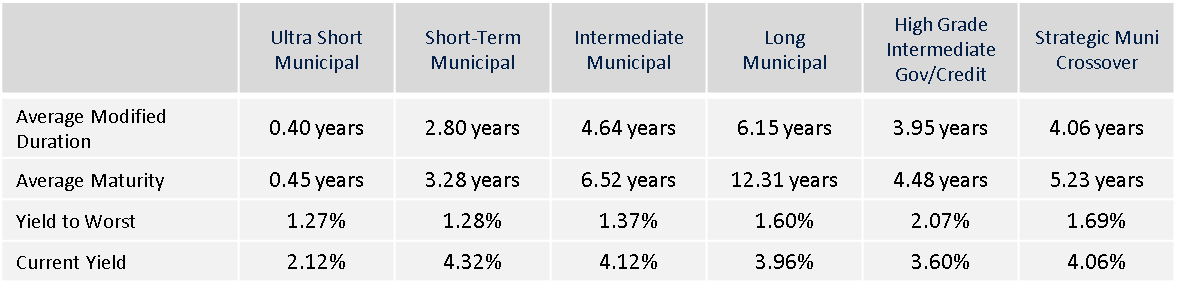
Strategy Overview
Portfolio Positioning as of 9/30/19
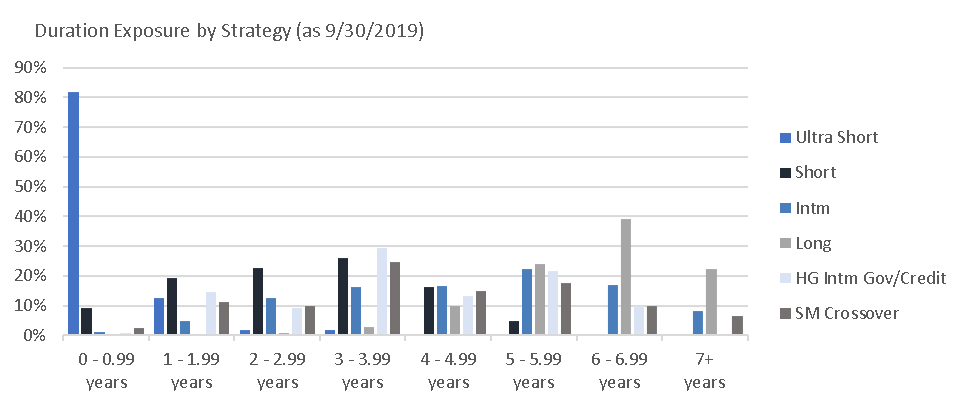
Duration Exposure by Strategy as of 9/30/19
Our Philosophy and Process
- Our objective is to preserve and grow your clients’ capital in a tax efficient manner.
- Dynamic active management and an emphasis on liquidity affords us the flexibility to react to changes in the credit, interest rate and yield curve environments.
- Dissecting the yield curve to target maturity exposure can help us capture value and capitalize on market inefficiencies as rate cycles change.
- Customized separate accounts are structured to meet your clients’ evolving tax, liquidity, risk tolerance and other unique needs.
- Intense credit research is applied within the liquid, high investment grade universe.
- Extensive fundamental, technical and economic analysis is utilized in making investment decisions.