


Insights and Observations
Economic, Public Policy, and Fed Developments
- September proved an eventful month for Fed watchers. After formally moving from a maximum to average 2% inflation target at the end of August, Fed officials were busy fleshing out the new policy. This was not without hiccups, as Chicago Fed President Charles Evans rattled the markets noting the Fed didn’t have to wait until the inflation rate broke 2% to raise rates, although he was discussing average, not current, inflation. Fed Presidents Clarida and Brainard were subsequently explicit on the Fed’s commitment to worrying about “shortfalls, not deviations,” from maximum employment. The bottom line is that the FOMC dot plot shows lower-bound rates through 2023 and we expect short term rates to remain near zero for the foreseeable future.
- Unexpectedly, Judy Shelton’s nomination to the Federal Reserve board fell back into jeopardy in September, as Senator John Thune publicly noted that her nomination would not be brought to the Senate floor until they were sure she had the votes to be confirmed, and at present they did not. We see Shelton as too overtly political and outside policy mainstream for the Fed’s board and would view a collapse in her nomination as positive for the markets.
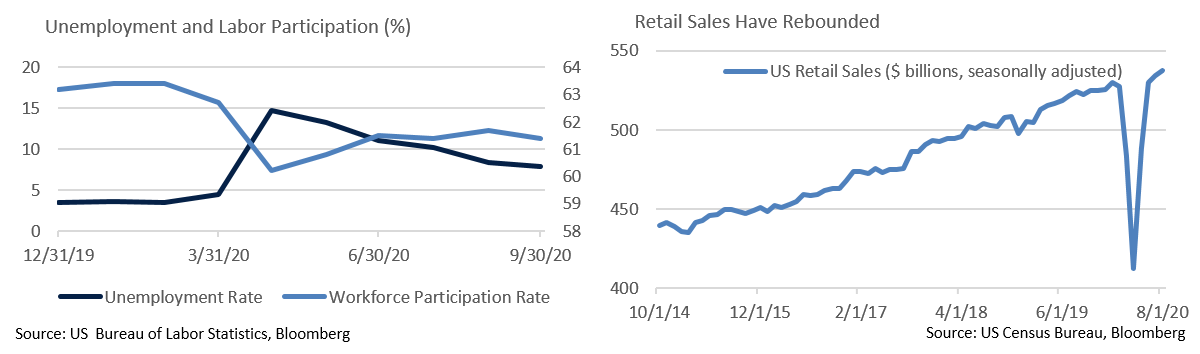
- Retail sales missed in August but remained positive; we have now seen four consecutive months of increases, but at steadily decreasing rates. While growth has been solid enough to return sales to their prior trendline of around 2% growth, the current sales recovery has been positively impacted by a shift in spending from services to goods and may overstate consumer strength.
- Another month of economic releases has brought greater clarity to the shape of the labor market, and while the recovery has been faster than we had anticipated, job growth appears to be slowing. Weekly unemployment and continuing claims data indicated the rate of progress may be decelerating, as confirmed by September’s BLS release. The headline missed, though mostly on public sector activity, as government employment lagged badly while private sector hiring broadly met expectations. Headline unemployment fell more than expected, 7.9% vs 8.4%, though largely due to a sizable decline in the participation rate.
- Lower unemployment attributable almost entirely to more workers permanently leaving the workforce does not point to economic health. Several prominent companies have announced large layoffs as stimulus paycheck protection programs expired. Absent a new stimulus deal supportive of employer payrolls, we expect further labor market deterioration in October.
- While stimulus talks continue, progress remains slow and fragile. At present, the gap between the parties has narrowed, with Speaker Pelosi at $2.2 trillion and Secretary Mnuchin at $1.6 trillion. However, upcoming Supreme Court confirmation hearings and rapidly approaching elections leaves little room to maneuver. Even with a weakening employment picture offering incentive, a pre-election stimulus deal looks doubtful.
- The final Q2 GDP revision came in at -31.4%, a modest improvement from an initial -34.5% reading and a prior revision of -32.5%. The Fed’s Weekly Economic Index suggests Q3 growth of around +20%. This Index is a good baseline expectation as we wait for the first release of Q3 economic growth. This has been a reasonably strong recovery, but it has been uneven – talk of a “V-shaped” recovery is increasingly giving way to a “K-shaped” one, as different segments of the economy have had very different experiences. Expect to hear more of this metaphor, especially as Q4 is looking relatively fragile.
- A chaotic first Presidential Debate did little to sooth increasingly concerned markets. Democratic nominee Biden has enjoyed sizeable, stable leads in national polls and remains favored to win, but a combative Trump pointedly refused to confirm he would accept the outcome if he lost. Futures markets that price volatility suggest that traders are bracing for equity market turmoil in November and paying unprecedented premiums for protection, implying the market is growing concerned about a 2000-like protracted battle. We share traders’ worries about the damage a lengthy court battle to settle the presidential election could have on the markets. President Trump’s COVID-19 diagnosis adds further uncertainty with the election less than a month away.

From the Trading Desk
Municipal Markets
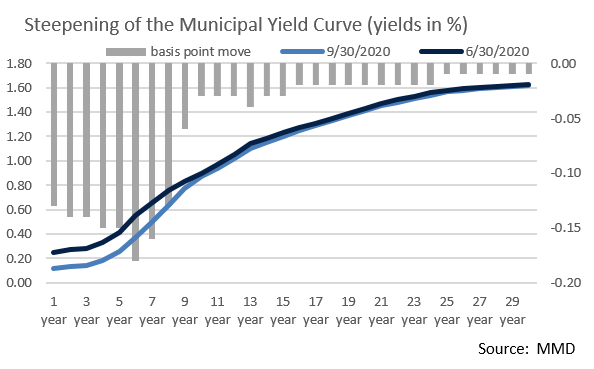
- The muni curve steepened over the course of Q3 with front end yields dropping by 13 to 14 basis points to leave the 2Yr at 13 basis points, while yields on the 10Yr to 30Yr end of the curve were essentially unchanged. Steepness from 2Yr to 10Yr on the AAA municipal curve is now 74 basis points, versus 63 basis points at the beginning of the quarter. This means that investors are being paid incrementally more for buying longer maturities through 10 years and we are actively looking for bonds in the 6 to 9-year portion of the curve.
- Yields on short maturities are still quite limited given the influence of Fed policy and very strong investor demand, the latter influenced by consistently high flows into short and limited maturity tax-exempt mutual funds. The 2Yr AAA municipal curve yielded 0.13% as of 9/30, down from 0.27% at the end of Q2. With the front-end anchored, cash alternatives like Variable Rate Demand Notes (VRDNs) remain low. SIFMA, the VRDN benchmark, closed September at only 11 bps.
- The 10Yr AAA municipal/UST ratio still suggests there is relative value in the high-quality tax-exempt markets. This often-cited ratio ended Q3 at 126%, as compared to a post-1990 average of 86.8%. As referenced earlier, relative value is somewhat reduced, yet still above long-term historical averages, at short (2Yr ratio of 100.0%) and long (30Yr ratio of 110.96%) maturities (as of 9/30).
Corporate Bond Markets
- September followed a similar pattern as the past few preceding months with bond issuers accelerating debt offerings given today’s stubbornly low rates and tight credit spreads. The $164 billion issued surpassed all other prior Septembers and is the seventh largest month on record. The persistence of this year’s IG Corporate issuance surge is noteworthy, as five of the largest historical monthly totals have been realized in 2020.
- On a year-over-year basis issuance is up 67% vs. 2019, with $1.54 trillion coming to market YTD, most of which is debt refinancing. The market has digested these offerings extremely well, although issuance may have peaked. As the election approaches and political and economic uncertainty grows, market sentiment could be impacted. The broker syndicate is estimating that October issuance may only reach $75 billion.
- With buyer demand remaining high, new issues have performed very well. Most offerings have been oversubscribed as investor demand has generally far exceeded the amount of bonds being offered. Strong fund flows and appetite for yield in the high-grade space has been persistent. This has helped keep IG spreads tight and a potential slowdown in new issuance would be another supportive factor.
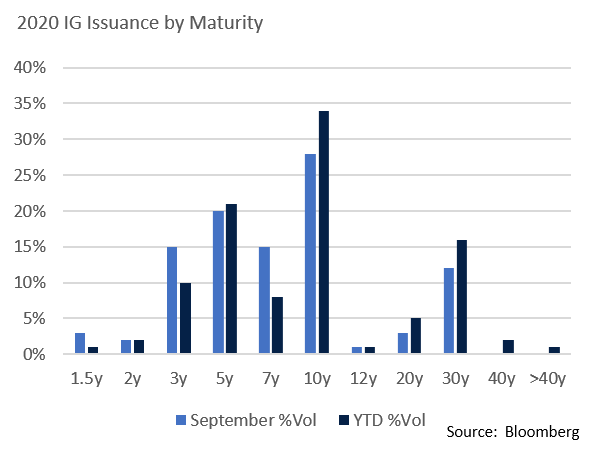
- Investor appetite for duration risk seems to be waning, as new issues are mostly coming inside of 10 years. Breaking down September issuance by maturity reveals that 83% was under 10 years vs. 70% on a YTD basis. The yield curve inside of 5 years and beyond 12 years is flat, although in between there is greater steepness and value for investors maintaining duration. This allows investors to pick up additional yield while maintaining duration risk and issuers are taking advantage of the demand.
- On an OAS basis, the spread on the Bloomberg Barclays Investment Grade Index began the year at 94 basis points and climbed to a high of 381 basis points on 3/23. There has since been a steady retraction and the Index’s OAS ended September at 134 basis points. It has been a very good couple of quarters for IG corporate investors.
Public Sector Watch
Credit Comments
Lack of a Stimulus Deal Is Not a “Credit Cliff”
- With the election nearing and Congress pivoting towards a contentious Supreme Court nomination, the chances for another stimulus package may be narrowing. We are not completely ruling out a bill being passed over the next few weeks, but it would be a surprise. The outcome of the election will likely impact the state and local government aid debate, although we still see potential for more government stimulus in Q1 ‘21.
- We would not view failure of Congress to pass an additional round of federal aid for state and local governments this fall as a “credit cliff.” Additional aid would lessen the burden of replacing revenue lost to curtailed economic activity and increased COVID-19 related costs; however, in its absence, municipalities are moving to reduce headcount, defer capital projects, and seek new or increased revenue sources.
- Catastrophic estimates of tax revenue declines made in the peak of the pandemic have fortunately not come to fruition. Tax collections are down year-over-year but remain far more manageable than originally expected.
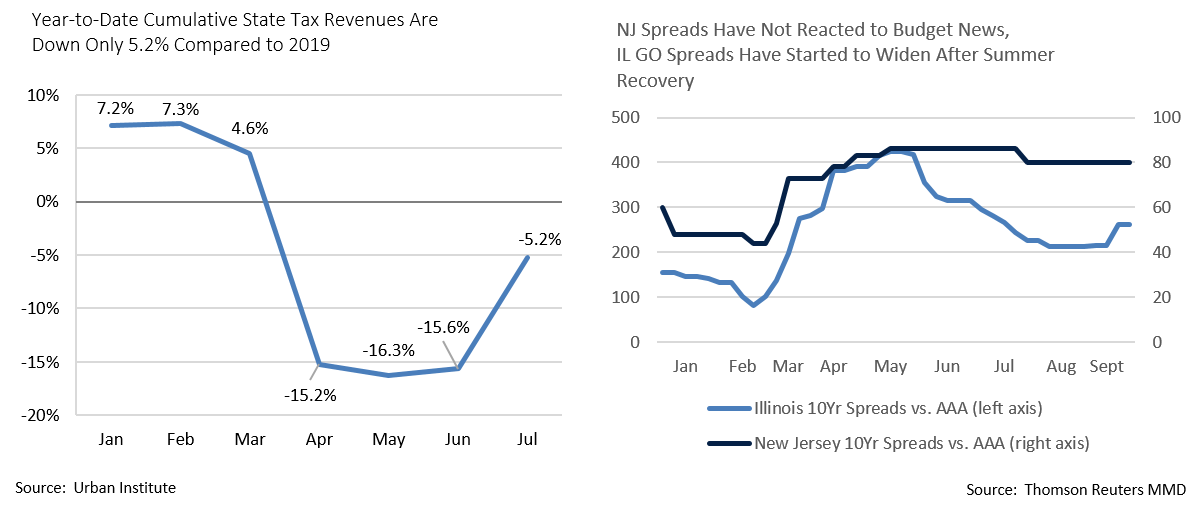
- Through July state tax revenues are only down 5.2% YTD compared to 2019.
- According to Bank of America, preliminary reporting for the month of August alone points to a median 5.0% year-over-year increase in state tax revenues.
- Local governments are experiencing similar revenue trends. Based on cities that provide monthly tax revenue data, 2020 tax revenues have declined less than 5% YTD. In some cases, revenues have increased, based largely on the impact of property taxes.
COVID-19 Magnifies Pre-Existing Credit Challenges
- Our opinion is that most States will maintain a high level of credit quality over the course of this crisis, supported by significant flexibility to proactively adjust to economic realities by cutting expenses and increasing revenue.
- Nonetheless, despite our generally positive sector-level view, security selection remains critical and certain credits introduce much greater concerns. Below we highlight two state credits we have long avoided – Illinois and New Jersey – as they represent examples of how pre-COVID credit challenges can limit the resources and tools available during a downturn.
- New Jersey recently approved a FY 2021 budget that included a “millionaire’s” surcharge, reduced pension contributions, and $4.0 billion in deficit financing. As a reference, $4.0 billion equals about 10% of spending and would increase New Jersey’s tax-supported outstanding debt by 11.9%, a sizeable jump in a short timeframe. And because many of the State’s budget adjustments are one-time in nature, unless revenues recover to roughly 2019 levels, state lawmakers will face many of these same budgetary hurdles next year.
- Illinois may be facing an even steeper hill to climb in FY 2021. Their budget relies on voters approving a graduated income tax structure this November that will bring in an extra $1.3 billion in revenue. The State also included a $5 billion placeholder for additional federal stimulus. While we discuss the narrowing prospects for federal aid above, even if a package is approved in Q4, Illinois’ allotment will likely be lower than the State is hoping for. Nearly 15% of the budget is reliant on uncertain resources, heightening the potential for significant challenges if those resources fail to materialize.
Strategy Overview
Portfolio Positioning as of 9/30/20
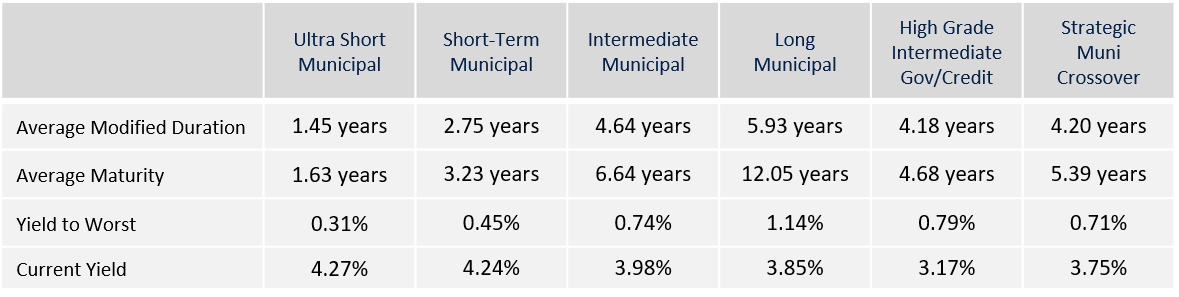
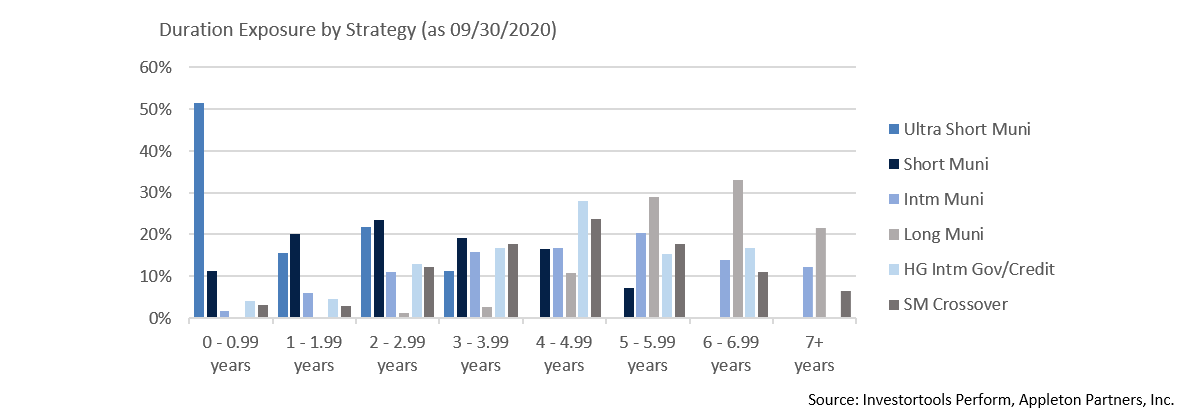
Duration Exposure by Strategy as of 9/30/20
Our Philosophy and Process
- Our objective is to preserve and grow your clients’ capital in a tax efficient manner.
- Dynamic active management and an emphasis on liquidity affords us the flexibility to react to changes in the credit, interest rate and yield curve environments.
- Dissecting the yield curve to target maturity exposure can help us capture value and capitalize on market inefficiencies as rate cycles change.
- Customized separate accounts are structured to meet your clients’ evolving tax, liquidity, risk tolerance and other unique needs.
- Intense credit research is applied within the liquid, high investment grade universe.
- Extensive fundamental, technical and economic analysis is utilized in making investment decisions.