


Insights & Observations
Economic, Public Policy, and Fed Developments
- September’s Fed decision was going to be a surprise no matter what, a rarity in the Powell era, with cut expectations closely balanced between the 25 and 50bps camps before the meeting. Powell ultimately went with 50, positioning this decision as a “catch-up” cut after better-than-expected June inflation data arrived after their July meeting. Indicating they likely would have cut then had they known what they know now, Powell pushed back against future 50bps cuts. He described risks to the Fed’s dual mandate as “relatively balanced,” and suggested the timing and size of future reductions would be data dependent.
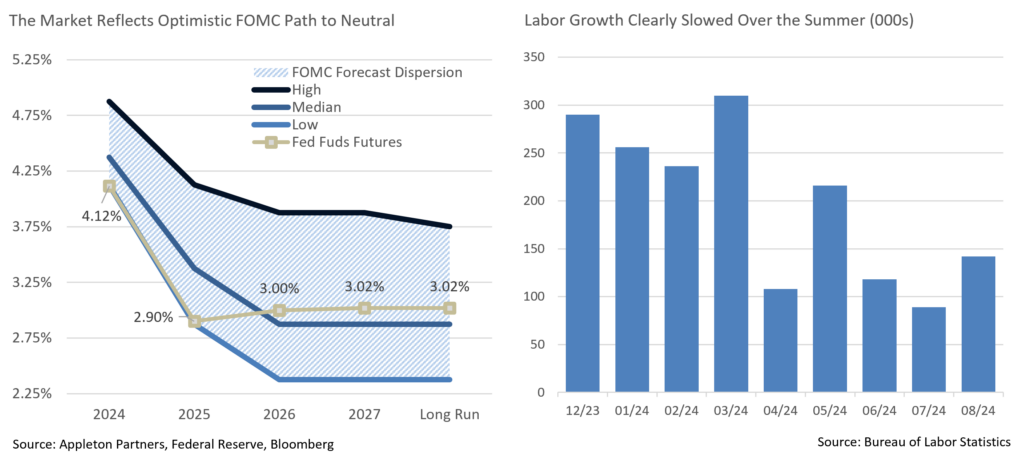
- Going into the meeting, we felt the size of the cut mattered less than the quarterly update to the Fed’s “dot plot,” which we expected to show less accommodation than the market foresaw. Sure enough, while the dots came down from June, they remain well above market consensus. The Fed funds futures market now matches the most optimistic of the dot plot projections for the next 12 months, suggesting future volatility as expectations unwind. Since the meeting, the market-implied long term neutral rate has begun to rise, which we feel is appropriate given the pronounced upward skew in the Fed’s estimations of neutral. Treasury yields have drifted up since the meeting to reflect this, a trend we expect to continue.
- With inflation benign, labor conditions are likely to drive future Fed policy changes. We’ve seen a deceleration in employment growth this year; August’s employment, at 142k new jobs, came in under expectations and brought with it moderate downward revisions to prior periods. September’s report, due on October 4th, is expected to only modestly rebound to 150k; an upside or downside surprise could set the tone for the rest of the year.
- A reason for cautious optimism came with the final revision to Q2 GDP. The headline report remained unchanged, at +3.0%. However, there was a substantial revision to GDI, Gross Domestic Income. GDP, by definition, equals GDI, so with GDI at +1.3% after the first revision, there was risk of a downward GDP revision. Instead, GDI was revised substantially up, to +3.4%. At least at the start of Q3 consumers had higher disposable income and savings than previously estimated. In theory, this should be supportive of labor demand and job creation.
- Another source of uncertainty will be the impact of Hurricane Helene, a “1,000-year storm” that ravaged North Carolina over the last several days. The human cost is incalculable; the impact on hiring in September will be modest given the timing of the storm, although it will undoubtedly depress October’s report.
- Inflation could still become a problem. Falling commodity prices have helped bring down headline inflation for much of the year, in part due to a sputtering Chinese economy. China unveiled a significant stimulus program on September 23rd, a multi-barreled approach to boosting growth that included lower rates and a loosening of housing market controls. The Chinese stock market roared in response. It’s unclear if even this package goes far enough to address China’s housing market problems, but if it translates into sustained demand, commodity prices could rise. This could boost US inflation at a time when core inflation is still running around 2.5%, above the Fed’s 2% target.
- Another possible source of price pressures could come if the International Longshoremen’s Association strike on the eastern seaboard that began on the first of the month stretches into weeks rather than days; roughly half of all US trade is estimated to pass through impacted ports.
From the Trading Desk
Municipal Markets
- The AAA municipal yield curve moved lower over the course of September in what was close to a parallel shift of about 10bps. Over the quarter, yield curve decreases were more significant at the 5 and 10-year spots at 44bps and 22bps, respectively, a continuation of curve normalization.
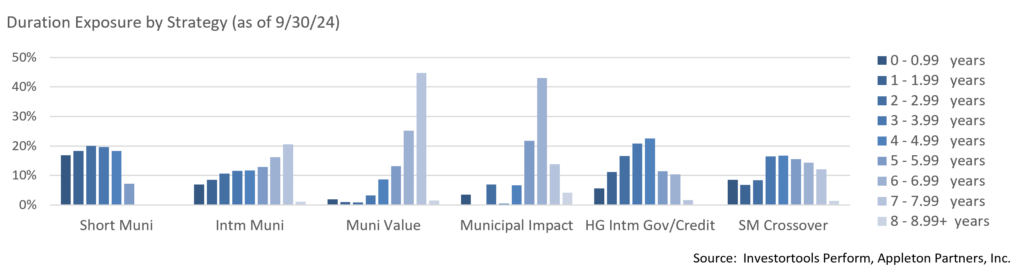
- After an historically atypical period of inversion, the municipal curve has finally steepened and the spread between 2s and 10s is once again positive at 30bps after starting Q3 with a 27bps inversion. This un-inverting process is new to the municipal market and investors are now charged with anticipating how the curve will evolve. As discussed, in Intermediate strategies, we are finding value in the belly of the curve between 6 and 9-year maturities after previously seeking to barbell exposure on the short and longer ends when curve inversion was pronounced.
- The 10-year AAA Muni/US Treasury ratio was largely unchanged in September, remaining right around 69%. Despite sitting below long-term averages, this level offers significantly more value than earlier in the year when it was in the high 50% range.
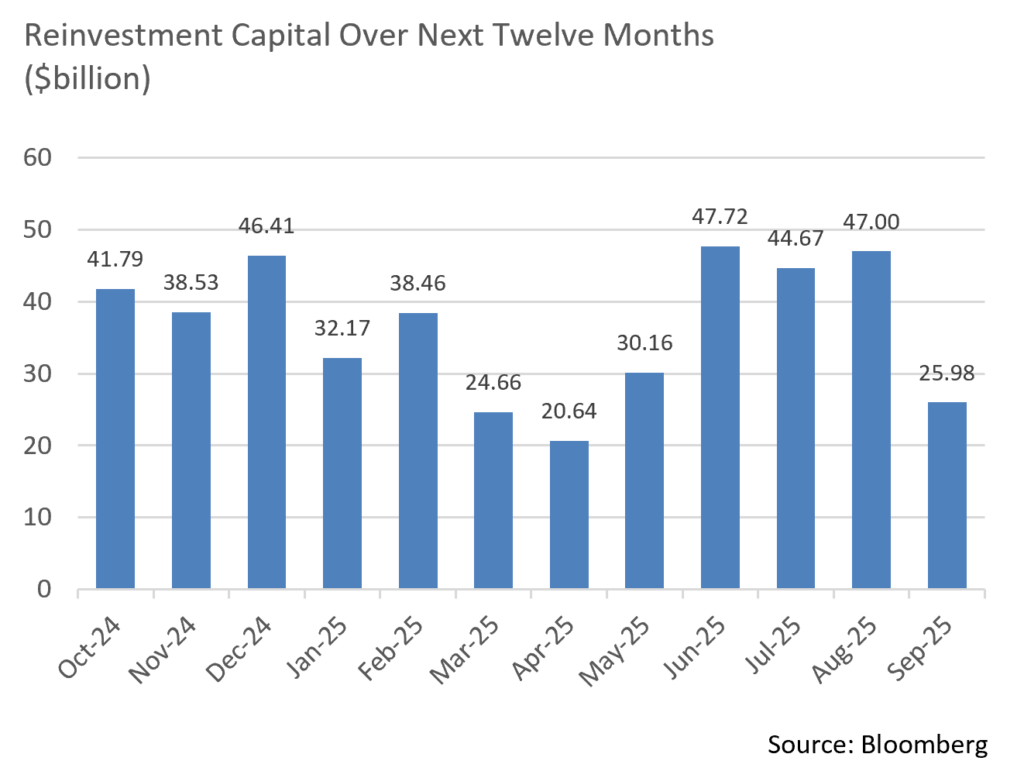
- Issuers are continuing to bring deals to market ahead of the election. According to Bloomberg, September saw a total of $49.16B in issuance, a 63% increase over the same time last year and the highest September total since 2020 during the pandemic. YTD, these elevated issuance levels are running about 35% ahead of last year’s comparison. While the summer months bring with them elevated reinvestment levels, September’s reinvestment capital was lower at $31B. Despite this technical support factor receding, September’s deals were well received by investors.
Corporate Markets
- September saw a flurry of new Investment Grade Corporate bond issuance as the Fed’s route to a lower Fed Funds rate became clearer after its October 50bps surprise. Fueling this new issue rush is the uncertainty of an impending Presidential election as well as a quiet earnings blackout initiated at the beginning of October. The $170.6 billion of new debt sold in September smashed previous highs ($164 billion during the pandemic in September 2020) to become the largest September on record, a surge in new supply that increased YTD issuance to $1.26 trillion.
- We expect new issuance to slow somewhat in Q4 as a degree of market volatility is anticipated. However, demand remains strong with new recent issue concessions mostly under 3bps, below historic norms. Another indication of robust credit appetite can be found in the high yield market, as 14 of 17 recent new offerings we tracked traded tighter in the secondary market a week out.
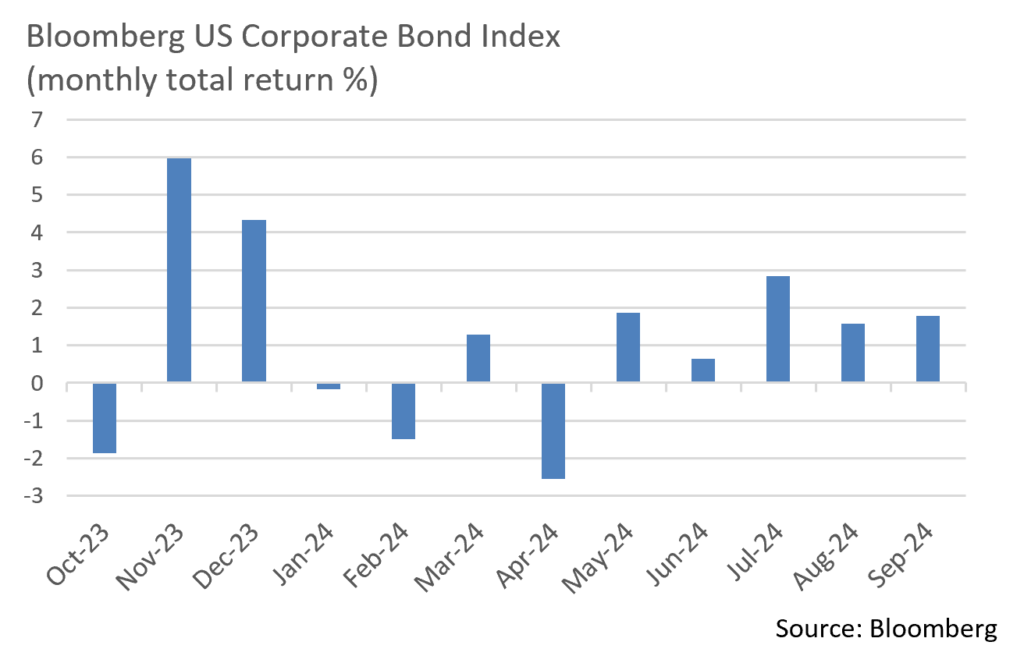
- Bolstered by strong demand, the Bloomberg US Investment Grade Credit Index recorded its 5th straight month of positive returns in September, raising it’s YTD total return to +5.32%. Longer maturities and lower quality issuers were the best performers, likely due to investors chasing yield ahead of the Fed’s easing. Although July was the best performing month of the year (+2.38%), this recent 5-month stretch marks the best sustained IG Credit performance in quite some time. Strong returns have largely been a function of downward pressure on UST yields, although excess returns over USTs have also added value.
- Amid the issuance flurry, the market has consistently demonstrated an ability to easily absorb new debt. An appetite for high quality bonds has kept spreads in check throughout the year. On an OAS basis, the Bloomberg US Corporate Bond Index began the month at 93bps and hit a high of 99bps mid-month only to rally on the Fed ease to close at 89bps. This is only 4bps off a May YTD low of 85bps and 10bps off where the year began. We continue to feel that spreads will remain range-bound through year-end.
Public Sector Watch
International Longshoremen’s Association Strike on East and Gulf Coasts
Union officials representing 45,000 workers at ports on the East and Gulf Coasts could not reach an agreement with employers at the United States Maritime Alliance, resulting in an employee strike that began on October 1st. The strike involves dockworkers based at dozens of ports from Maine to Texas and will significantly impact the movement of goods across the US.
- East and Gulf Coast Ports are main gateways for food, vehicles, heavy machinery, construction materials, clothes, and toys. JP Morgan estimates the strike could cost the US economy between $3.8 billion and $4.5 billion a day. Positively, some of this should be recovered once the strike is resolved.
- The International Longshoremen’s Association (ILA) union is pushing for a 77% wage increase for workers over six years, and employers have countered with about half of that. By comparison, last year the International Longshore Warehouse Union won dockworkers at West Coast ports a 32% wage increase over six years. The union is also pushing to limit automation in an effort to protect jobs.
- The strike comes just five weeks before the presidential election. The White House has not yet intervened, although Biden Administration officials have met with leaders of a group representing port employers, urging them to continue with negotiations.
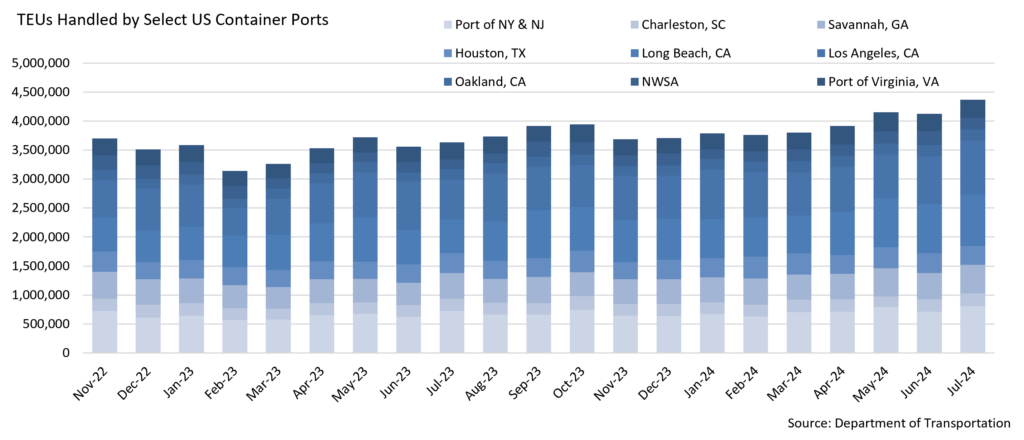
- This is one of the busiest times of the year for ports planning for increased shipments ahead of the Christmas season. Companies have been aware of a potential strike and were prepared for it, with many scheduling early shipments. This has led to a significant spike in August container volumes, with US importers bringing in almost 2.4 million TEUs (“Twenty-foot Equivalent Units”), +21% from the same time last year and the highest monthly level since pandemic peaks in May of 2022.
- Companies have also shifted container volumes toward West Coast ports such as the Port of Long Beach and Los Angeles. Both have seen increased shares of US cargo volumes, a contrast with recent years when new infrastructure had made East Coast shipping more attractive. West Coast ports handled 61% of imports from Asia in June and July, the highest share since October 2021. The Port of Long Beach and Port of Los Angeles’ combined cargo volume increased 47.4% in July YoY and rose an additional 3.1% in August.
- While East Coast ports have also seen an increase in recent months, the strike could quickly offset these increased revenues depending on its duration. Moody’s recently stated that a strike of 10 days or longer would have to occur to have a material negative impact on East and Gulf Coast ports.
- Many east and gulf coast ports have diversified revenue streams which mitigates credit risk related to the port strikes. Ports considered to be landlord ports also have limited risk as they are not as impacted by cargo volumes as operational ports. While Appleton does own operational ports that may face temporary operational disruptions, a prolonged strike would be needed to have a significant financial impact on these credits.
- Positively, the credits owned at Appleton partners with direct exposure to cargo volumes have very strong liquidity with over two years of cash on hand available to help mitigate potential financial impact. We will continue to monitor the strike’s impact on each of the port issuers we own, along with broader economic effects.
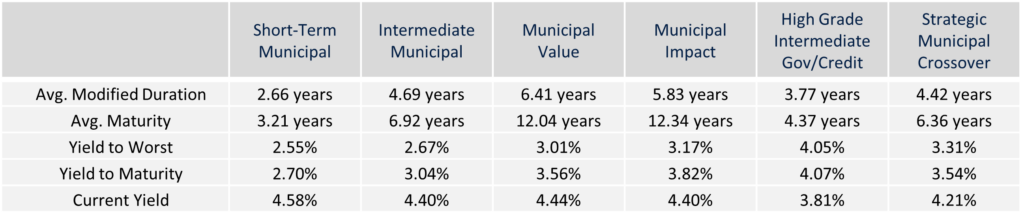
Composite Portfolio Positioning (As of 9/30/24)
Strategy Overview
Duration Exposure
The composites used to calculate strategy characteristics (“Characteristic Composites”) are subsets of the account groups used to calculate strategy performance (“Performance Composites”). Characteristic Composites excludes any account in the Performance Composite where cash exceeds 10% of the portfolio. Therefore, Characteristic Composites can be a smaller subset of accounts than Performance Composites. Inclusion of the additional accounts in the Characteristic Composites would likely alter the characteristics displayed above by the excess cash. Please contact us if you would like to see characteristics of Appleton’s Performance Composites.
Yield is a moment-in-time statistical metric for fixed income securities that helps investors determine the value of a security, portfolio or composite. YTW and YTM assume that the investor holds the bond to its call date or maturity. YTW and YTM are two of many factors that ultimately determine the rate of return of a bond or portfolio. Other factors include re-investment rate, whether the bond is held to maturity and whether the entity actually makes the coupon payments. Current Yield strictly measures a bond or portfolio’s cash flows and has no bearing on performance. For calculation purposes, Appleton uses an assumed cash yield which is updated on the last day of each quarter to match that of the Schwab Municipal Money Fund.
This commentary reflects the opinions of Appleton Partners based on information that we believe to be reliable. It is intended for informational purposes only, and not to suggest any specific performance or results, nor should it be considered investment, financial, tax or other professional advice. It is not an offer or solicitation. Views regarding the economy, securities markets or other specialized areas, like all predictors of future events, cannot be guaranteed to be accurate and may result in economic loss to the investor. While the Adviser believes the outside data sources cited to be credible, it has not independently verified the correctness of any of their inputs or calculations and, therefore, does not warranty the accuracy of any third-party sources or information. Any securities identified were selected for illustrative purposes only, as a vehicle for demonstrating investment analysis and decision making. Investment process, strategies, philosophies, allocations, performance composition, target characteristics and other parameters are current as of the date indicated and are subject to change without prior notice. Not all products listed are available on every platform and certain strategies may not be available to all investors. Financial professionals should contact their home offices. Registration with the SEC should not be construed as an endorsement or an indicator of investment skill acumen or experience. Investments and insurance products are not FDIC or any other government agency insured, are not bank guaranteed, and may lose value.