


Insights & Observations
Economic, Public Policy, and Fed Developments
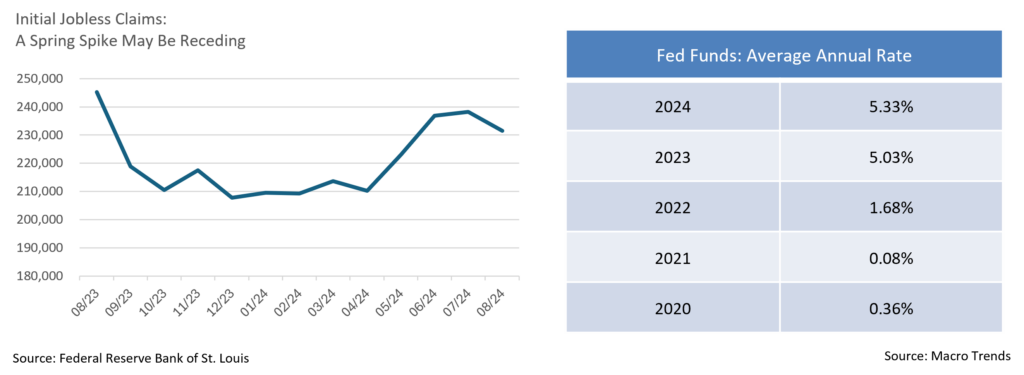
- Cyclical change is often clearer after the fact than during the process. Inflation has garnered the lion’s share of economic attention over recent years, the fight against which prompted 11 rate increases from 2022 to 2023 and a surge in Fed Funds from a record low 0.08% to today’s 5.33%, the highest level in over 20 years. For some time now, bad economic news has effectively been good news, as equities have tended to rally on the perception that progress in the fight against inflation would open the door to Fed rate cuts. That psychology may be changing.
- A turning point came on 8/1 and 8/2 with initial monthly jobless claims of 249,000 exceeding consensus estimates, ISM missing (46.8 vs. 48.8), and non-farm payrolls falling far short of expectations (+114,000 vs. +175,000), all of which set off alarm bells. A macro backdrop intensely focused on when the Fed would be at liberty to start reducing rates quickly turned to recession risk and whether monetary policy was behind the curve with cuts needed quickly. Over two trading days, the S&P 500 fell -3.20%, and 10Yr UST yields declined by 24bps. A rapid unwinding of the Yen carry trade involving borrowing ultra-low-interest rate currencies and reinvesting in a higher yielding US$ only exacerbated early August’s volatility.
- With a turn in monetary policy almost certainly upon us, market participants have become far more focused on the magnitude of rate cuts than their timing. Chairman Powell’s comments at the Jackson Hole Conference all but assured that September’s FOMC meeting will deliver a much-anticipated cut. Headlines eagerly reported Powell’s statement that “the time has come for policy to adjust,” and 2Yr UST yields quickly fell 12bps from 4.01% at the 8/22 close to 3.89% at the end of 8/28 trading.
- What curiously drew less attention was “the balance of risks,” a data dependent Fed assessment of economic conditions and policy response. The post-pandemic surge in global inflation has definitively moderated, and favorable comparisons to August and September 2023 (+0.6% and +0.4%, respectively) may soon result in annualized inflation reaching the Fed’s all-important 2% annual target. At this stage, we would argue that policy deliberations are focusing more on risks to growth and employment than inflation, as well as what the size of rate cuts will signal about the economy.
- The persistence of yield curve inversion is noteworthy, and with roughly a 150bps gap between Fed Funds and 2Yr USTs, this is the longest and widest inversion on record, a reality that suggests recession risk remains. Housing activity has slowed, and recent labor reports have been relatively weak, but not alarming. We are not currently in the recession camp and still see a “soft landing” as likely, although it may be a bumpy process. A series of recent reports suggests GDP growth is slowing back towards its long term +2% trendline, not recessionary levels, and late August data reported an in-line to slightly better than expected jobs report, as well as a reassuring PCE inflation print.
- Post-Labor Day ISM and labor market reports will be revealing and closely watched by the Fed. Today’s debate centers on the size of September’s pending cut, and we are of the view that the market will get 0.25%, not 0.50%. The latter would be politically problematic and holding off until November’s meeting allows the Fed to get past the election and assess two more months of economic data. CME Fed Watch is now calling for 100bps by year-end, an expectation that seems high to us unless the economy deteriorates more than we expect. Viewed through the prism of the equity markets and other risk assets, a “good news is good news” environment is back, as reassuring economic data will give the Fed license to ease in a slow and orderly manner, whereas large cuts risk signaling greater concern.
From the Trading Desk
Municipal Markets
- As we say goodbye to summer, we also say farewell to the very large reinvestment capital of the summer season. During these months, the municipal market enjoys significant support from the bond maturities and calls that investors are looking to put back to work. However, as we look forward to the fall and end of the year, the market will not have that crutch, and we may see some added volatility around seasonal issuance spikes.
- Supply has been at the forefront throughout the year and that dynamic continues. According to Bloomberg, August bond sales were about $50 billion, the biggest month year-to-date, evoking similar sentiment as previous election year spikes. The trend of increased issuance ahead of elections is largely due to issuers aiming to avoid potential volatility surrounding the presidential election. So far this year, issuance has consistently run ahead of last year’s numbers and is currently up about 35%.
- We expect that the combination of increased supply and limited reinvestment demand could elevate yields, providing an opportunity for municipal buyers. The 10-year AAA Muni/Treasury ratio is hovering around 70%, and if supply remains elevated this could push ratios higher, adding potential value for municipal investors.
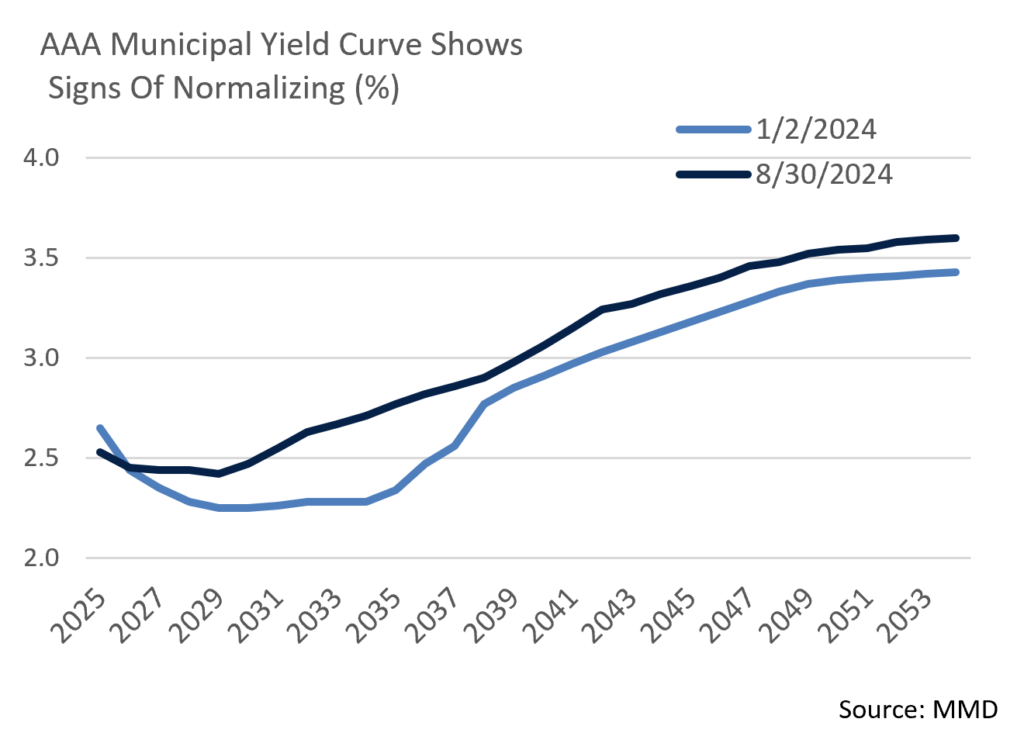
- The municipal curve has been working towards normalization for some months now and signs suggest that we are approaching a typical, upward sloping yield curve. Despite portions of the curve remaining inverted, the spread between 2Yr and 10Yr AAAs is +26bps, the highest we have seen during this normalization process.
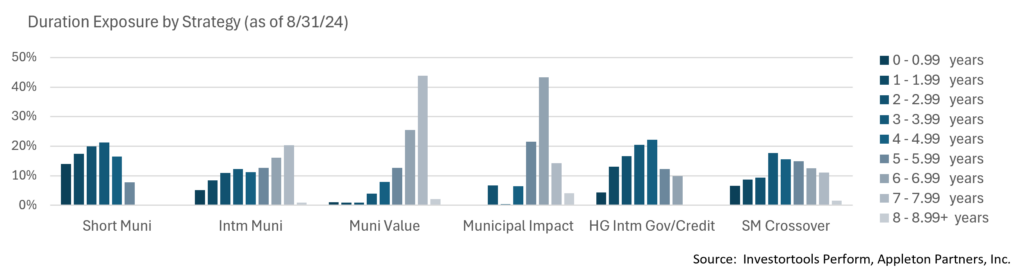
- As the structure of the yield curve evolves, we are adjusting our Intermediate strategy buying pattern accordingly. When the curve was significantly inverted, we were finding the most value on the tails of our buying pattern: 1-3 years and 9-12 years with limited exposure in the trough of the curve, creating a barbell shape. We are now actively looking to add exposure in the belly of the curve as yields of those maturities increase. This will bring our maturity exposure closer to a bell-shaped distribution as a means of better capturing the value of an upward sloping yield curve.
Corporate Markets
- The backdrop for Investment Grade credit issuance remains favorable and issuers have been taking advantage throughout the year. However, August was slower than anticipated with only $108.6 billion coming to market vs. the $125 billion expected by syndicate desks. This was not terribly surprising, as August is a seasonally slower issuance month, although the total fell far short of $161 billion issued in the same month of 2023.
- This does not feel to us like the start of a slowdown trend, and it could be a useful break before an expected onslaught of deals in September. For months, issuers have been preparing for a widely expected Fed Funds Rate cut in September followed by the US election. Both could create market volatility, which tends to dampen issuance.
- At first glance, Investment Grade credit spreads seemed calm as August ended at the same OAS level as it began, although viewed more closely, the month brought heightened spread volatility. The month began with a spike in OAS on the Bloomberg US Corporate Index from 83bps to 111bps just 4 trading days later. That was the highest spreads have hit all year and a level not seen since November 2023. This quick risk-off adjustment was prompted by a lackluster jobs report on 8/2. As with equities, this was later seen as an overreaction as buyers soon returned in earnest, driving OAS back to 93bps later in the month. Until the Fed takes action to reduce the Fed Funds rate and offer insight into forward monetary policy, the markets will likely remain highly reactive to economic data and other market news, although we continue to anticipate a range-bound market.
- Through the end of July, $16,687 billion of new gross US Treasury supply has been sold. That is up 43.2% YoY and has facilitated a net cash raise of $950 billion. Peak issuance came in 2020, a period marked by massive pandemic relief, as $20,951 billion was sold with net cash raised of $4,282 billion. This year’s issuance surge has been led by demand for US Treasury Bills (1 year or less in maturity), although we expect to see greater demand for longer US Treasury Notes going forward given an expectation of falling short rates. More broadly, with $27.4 trillion of outstanding US Treasury debt, the market’s willingness to fund prolific federal borrowing without driving up yields remains a strategic risk. For now, demand has remained intact.
Public Sector Watch
Implications of Sales Tax Revenues on Municipalities
Monthly State Tax Revenue Results:
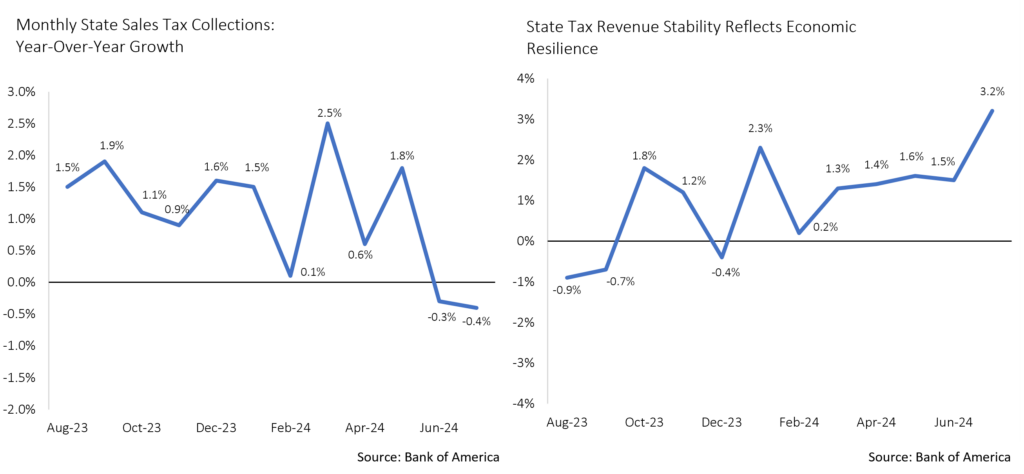
Bank of America provides monthly updates on state tax revenue trends. In the Bank’s latest publication, it noted that median sales tax collections in July are pointing to a -0.4% decline, which would be the second consecutive drop after June’s -0.3% YoY posting. B of A’s strategists emphasized that if July does finish down, it would mark the first consecutive months of declines since April and May of 2020.
Appleton’s Interpretation:
The near-term trend is notable in that it reflects a slowing economy, but it is not a reason to ring alarm bells. The declines are modest (less than 1%), follow only nominally positive results (+1.4% avg. prior 10 months), and a deceleration in sales tax revenues should be expected for the following two reasons: 1) sales taxes directly benefited from pent up demand and spending coming out of the pandemic, and that level of spending was not sustainable; and 2) more so than other tax revenue sources, sales taxes benefit directly from higher inflation (higher prices = higher sales tax collections, as long as spending remains healthy). So, with inflation coming down, sales taxes should fall as well (assuming spending is relatively stable).
State Credit Implications:
While some states are naturally more leveraged to sales taxes than others – notably non-income tax states such as Florida and Texas – we don’t view the modest drop in national sales tax data as concerning for those “sales tax” states. Specifically relative to Texas and Florida, they continue to benefit from unique demographic trends and their sales tax collections are likely to outperform national trends. Given only modest declines in national sales tax collection, we do not believe there are noteworthy credit implications at this time.
State Revenue Trends Remain Stable:
Supported by growth in personal and corporate income taxes, overall State revenue trends are stable to slightly positive. While we do not expect revenues to continue rising, the trend in State tax revenues remains healthy, and is a good proxy for the stability of overall municipal credit conditions.
Composite Portfolio Positioning (As of 8/31/24)
Strategy Overview
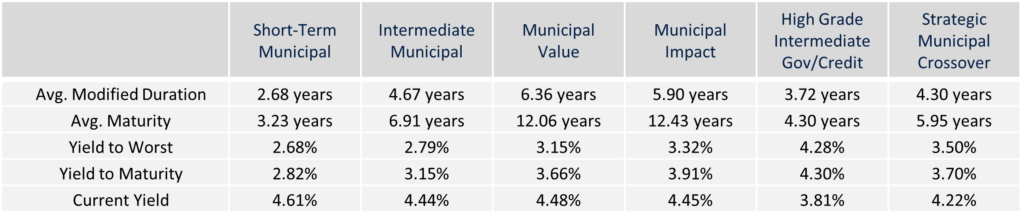
Duration Exposure (as of 8/31/24)
The composites used to calculate strategy characteristics (“Characteristic Composites”) are subsets of the account groups used to calculate strategy performance (“Performance Composites”). Characteristic Composites excludes any account in the Performance Composite where cash exceeds 10% of the portfolio. Therefore, Characteristic Composites can be a smaller subset of accounts than Performance Composites. Inclusion of the additional accounts in the Characteristic Composites would likely alter the characteristics displayed above by the excess cash. Please contact us if you would like to see characteristics of Appleton’s Performance Composites.
Yield is a moment-in-time statistical metric for fixed income securities that helps investors determine the value of a security, portfolio or composite. YTW and YTM assume that the investor holds the bond to its call date or maturity. YTW and YTM are two of many factors that ultimately determine the rate of return of a bond or portfolio. Other factors include re-investment rate, whether the bond is held to maturity and whether the entity actually makes the coupon payments. Current Yield strictly measures a bond or portfolio’s cash flows and has no bearing on performance. For calculation purposes, Appleton uses an assumed cash yield which is updated on the last day of each quarter to match that of the Schwab Municipal Money Fund.
This commentary reflects the opinions of Appleton Partners based on information that we believe to be reliable. It is intended for informational purposes only, and not to suggest any specific performance or results, nor should it be considered investment, financial, tax or other professional advice. It is not an offer or solicitation. Views regarding the economy, securities markets or other specialized areas, like all predictors of future events, cannot be guaranteed to be accurate and may result in economic loss to the investor. While the Adviser believes the outside data sources cited to be credible, it has not independently verified the correctness of any of their inputs or calculations and, therefore, does not warranty the accuracy of any third-party sources or information. Any securities identified were selected for illustrative purposes only, as a vehicle for demonstrating investment analysis and decision making. Investment process, strategies, philosophies, allocations, performance composition, target characteristics and other parameters are current as of the date indicated and are subject to change without prior notice. Not all products listed are available on every platform and certain strategies may not be available to all investors. Financial professionals should contact their home offices. Registration with the SEC should not be construed as an endorsement or an indicator of investment skill acumen or experience. Investments and insurance products are not FDIC or any other government agency insured, are not bank guaranteed, and may lose value.