


Insights & Observations
Economic, Public Policy, and Fed Developments
- While news coming out of Washington dominated the financial press in the second half of January, it shouldn’t entirely draw attention from the fact that, at the moment, we have a pretty good economic backdrop.
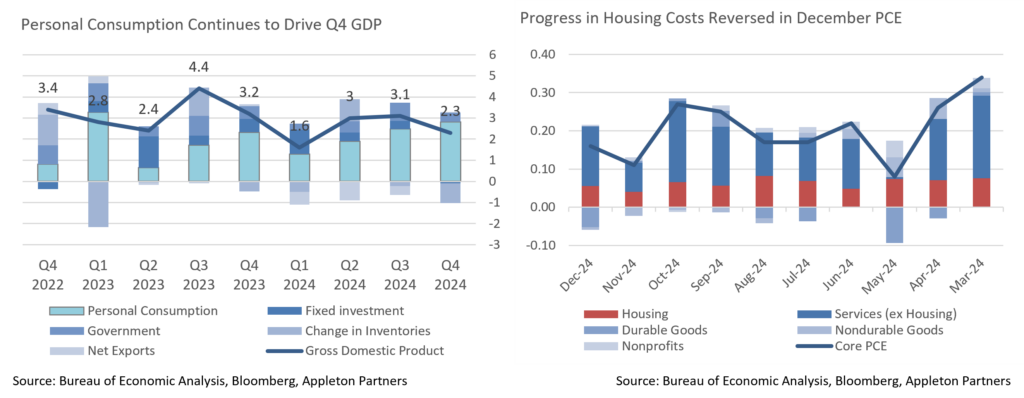
- Strong December hiring was followed by evidence of consumer strength in January. Most notable was the initial Q4 GDP print, which despite a moderate headline +2.3%, showed strong underlying consumer demand. Final Sales to Private Domestic Purchasers grew a robust +3.2%, and there was a whopping +4.2% increase in Personal Consumption. Ironically, despite anecdotal talk of tariff frontrunning, net inventories detracted nearly a point; this either leaves room for a potential upward revision to growth or is a sign that consumers were even more aggressive in frontrunning tariffs than companies.
- Speaking of tariffs, Trump began rolling these out on the last day of the month, announcing 25% tariffs on Canada and Mexico, 10% on China, and that unspecified EU tariffs were coming. The timing suggested room for negotiation, and sure enough, Mexico and Canada (though not China) have secured one-month delays. However, we’d note the anticipated range of potential trade-related outcomes has shifted significantly towards the most protectionist outcomes after initial post-election optimism.
- Meanwhile, Elon Musk has begun broad federal staffing reductions, shutting down entire offices and lines of business. Policy and legal implications aside, we would note that the federal government is the largest employer in the country, with more than 3 million Americans, or nearly 1.6% of the workforce. If there’s ever a time to reduce federal headcount it’s when a robust economy can absorb job losses, but tens to hundreds of thousands of newly unemployed federal workers may begin to weigh on growth as the year progresses. With commentary mostly focused on the political nature of these moves, the market may be underappreciating these risks.
- The Federal Reserve meeting on January 29th was largely uneventful, combining a more hawkish than expected statement with a fairly dovish press conference. A change in the statement garnered much attention, removing a reference to the labor market as having “generally eased, and the unemployment rate has moved up but remains low” in favor of calling it “solid,” and with the unemployment rate “stabilizing at a low level.” In his press conference, Powell described this as “language cleanup” rather than a meaningful change. We disagree; the Fed statement is largely static between meetings. These phrases had been in place in November and were broad enough to describe October’s outright hiring weakness; the current statement would no longer support any sign of weakness. Coupled with removal of language referencing progress on inflation, we believe this signals a Fed turning back from employment to the inflation side of their mandate.
- Ironically, this follows a decent stretch of inflation data. While we’re hardly out of the woods yet, December brought good news for both CPI (where Headline came in a tenth high but Core beat by a tenth) and PCE (where Core came within a few hundredths of rounding to a beat, though with a snap-back in housing costs after November’s improvement). January marks the start of a quarter with favorable year-over-year comps, which may help annual rates, but also one where seasonal factors have in the past pushed inflation higher, particularly in January.
Source: Bureau of Economic Analysis, Bureau of Labor Statistics , US Dept. of Commerce, Pew Research, Bloomberg
Equity News and Notes
A Look At The Markets
- Stocks started off 2025 with gains, rebounding from the prior month’s declines as the S&P 500 advanced +2.7%. Gains were broad-based, with ten of the eleven sectors moving higher and only Technology, the S&P’s sector leader in 2023 and 2024, declining (-2.9%). Leadership was mixed with a combination of growth and cyclicals driving seven of the sectors to outperform the broader market. The heavy tech Nasdaq underperformed all major averages although it still registered a +1.6% gain for the month. The DJIA, a notable underperformer in 2024, led the way higher, rising +4.7%.
- January had no shortage of risks and uncertainties – the CA wildfires, the Inauguration followed by a slew of executive orders, tariff talk, and a shakeup in the AI trade. As active discretionary managers, we try to remain dispassionate amid headline “noise,” instead focusing on fundamental drivers that we believe will remain in place. As discussed at the end of December, the stock market closed the year growing uncomfortable with a rise in interest rates and the US dollar. Both of those finished lower in January, offering investors a reprieve. Economic data was cooperative, and a solid labor market sustained consumer spending.
- We look to the health of corporate earnings as a fundamental barometer for equity markets. The Q4 reporting season has got off to a solid start with 77% of S&P 500 companies reporting to date beating estimates, with an average beat margin of 5.0%. This has lifted the blended earnings growth rate up to +13.2% vs. a year-end estimate of +11.8%. If +13.2% holds when reporting concludes it will mark the S&P 500’s highest quarterly earnings growth reading since Q4 of 2021. Full year 2024 S&P 500 earnings are on track to grow +9.4% with early 2025 estimates at +14.3%, the achievement of which would deliver a tailwind for equities even if valuation levels remain unchanged.
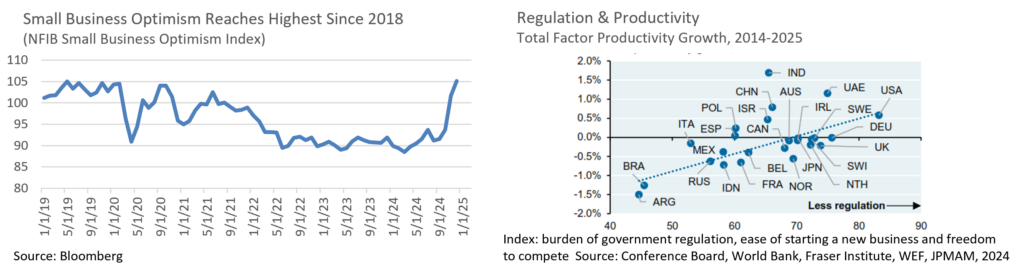
- A dynamic we feel is important to track lies in the relationship between confidence and spending, particularly for corporations as one company’s spending is another company’s profit. For much of 2024, business leaders were uncertain about the election and the potential impact on their businesses. Despite considerable policy uncertainty in certain respects, the election overhang being lifted and the promise of reduced regulation has produced a sharp increase in business confidence. with the NFIB Small Business Optimism Index hitting its highest level since late 2018.
- If capex and hiring are unlocked we should see a favorable environment for consumer spending and corporate profits. Given the relationship between regulation and productivity, we will be watching to see if the assumed bump in productivity is enough to offset the potential drag from tariffs and the impact on labor supply from accelerated deportation and tighter immigration restrictions.
- January was not without volatility as two worries materialized. First was the announcement that a Chinese large language AI model had performed on par with American models despite allegedly being trained at a fraction of the cost using less sophisticated chips. This called into question not only America’s leadership in the space but, more importantly, estimates of pending spending by tech companies on chips and power infrastructure. The immediate result was a significant drop in the valuation multiple being paid for semiconductor companies such as Nvidia which lost a record $589 billion in market cap in a single day. This is an example of index and other portfolio concentration risks we have cited, and why we take a more balanced, diversified approach.
- The second threat to a positive market outlook popped up at the end of the month as President Trump initially followed through on promises to assess punitive tariffs on China, Mexico, and Canada. If the current tariffs were to be implemented in full, it would be akin to a corporate tax rate hike of nearly 10%, much of which would presumably be passed on to consumers. Tariffs on Mexico and Canada were quickly postponed for 30 days; now we await the next development. We believe the muted reaction thus far reflects a market that doesn’t believe the initial tariff salvo will be fully enacted, and that the threat of tariffs will be enough to get the concessions the President is seeking. We will be closely monitoring the situation and its impact on inflation expectations, a key input into interest rates and the currency markets.
Source: Bloomberg, Factset
From the Trading Desk
Municipal Markets
- Over the last month, the muni curve bull steepened with the 2Yr down 15bps and the 10Yr down 9bps. The end of January saw the spread between 2s and 10s at 30bps, 6 bps steeper than where it started the month at 24bps. Interestingly, the longer part of the curve has also steepened, with the spread between 2s to 30s moving up to 130bps from 108bps, it’s level at the beginning of the month.
- Throughout 2024, increased supply was a highlight, and that trend continued through January. January 2025 issuance was 18% above levels for the month in the previous year. We are also watching issuance levels for February, which is generally a lighter month. According to Bloomberg, over the past 10 years issuance in the month has averaged $29.9 billion. However, we may see another period of elevated issuance in February due to the fear of the tax exemption being eliminated and issuers attempting to get ahead of any changes that may negatively impact the market. We note that based on the consensus of many market strategists, we believe the threat of elimination of the tax exemption to be remote. 30-day visible supply does not yet reflect an increased level at just $8.7 billion.
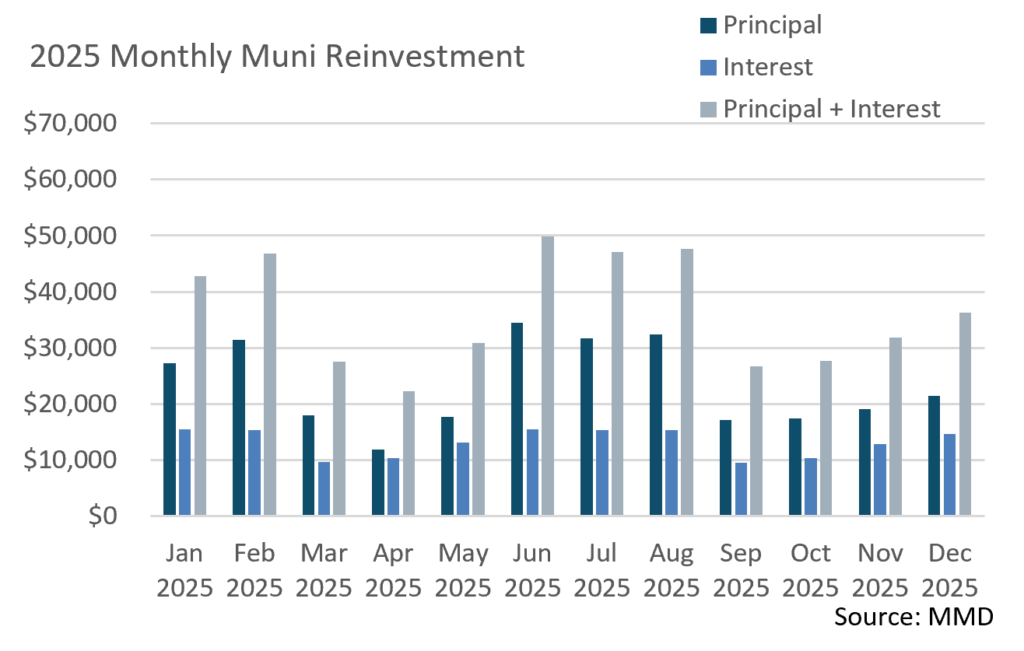
- Demand should remain intact during February due to heightened reinvestment levels. January reinvestment, including both principal and interest, totaled over $42 billion. However, February reinvestment at over $46 billion, is projected to be the highest until June. Leading the redemptions are Texas, California, and New York, which make logical sense given that these States are also the most prolific issuers .
Corporate Markets
- As market fundamental strength spilled over from the end of 2024 and into the start of 2025, January expectations for US IG issuance reached $175 billion. Issuers were active the last week of the month, and the pursuit of a record setting January was in sight. However, the January Fed meeting diminished momentum, leaving the last week’s total at $31.6 and the month at $186.4 billion. This was just $3 billion short of the record set in January of 2024, while the 10 year average for the month of January is $138 billion. February has the potential to be just as busy with $175 billion of new debt coming to market and the total amount expected in 2025 is $1.5 trillion. The new issuance landscape continues to be attractive with UST rates only slightly higher YTD, low concessions needed to get deals done, and insatiable demand ready to absorb the new debt.
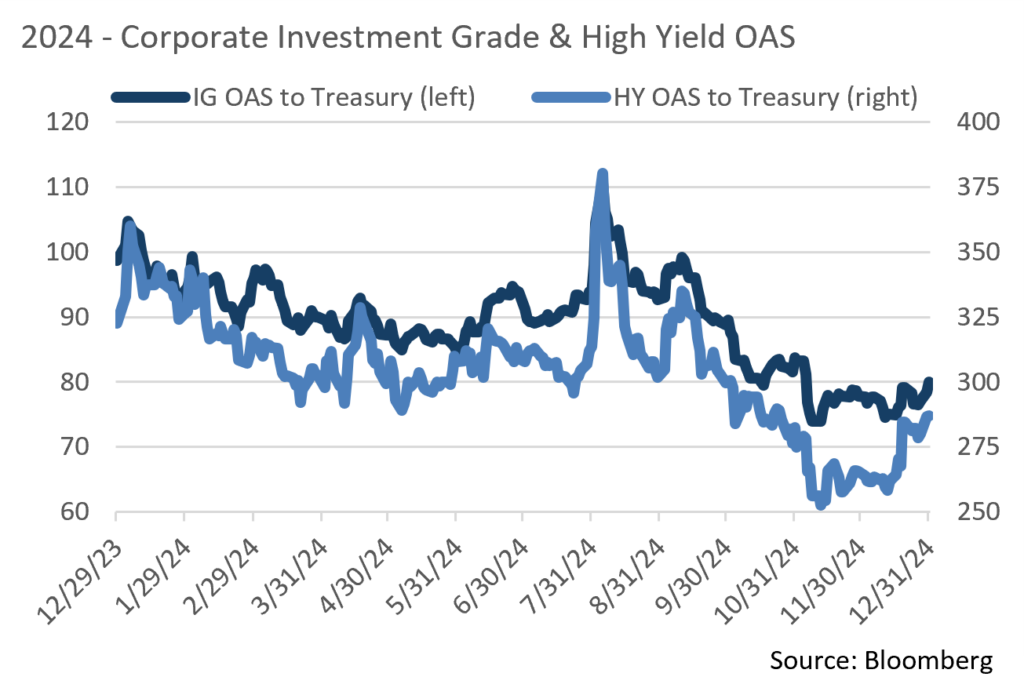
- Throughout 2024, we mentioned the overall resiliency that IG credit spreads had displayed throughout the year, with the average OAS on the Bloomberg US IG index at 89bps vs. the 124bps average over the last 10 years. This average includes a 2 month window in 2020 where spreads gapped out due to COVID. The low during that time was set back in November 2024 at 74bps, and January closed at an OAS of 79bps, just 5bps off of the 10 year low. It is still our view that spreads should remain range bound in the near term but could come under pressure as risk sentiment shifts have become more varied. Demand in both the primary and secondary markets remain very strong though.
- Lipper fund flow data continues to be positive for new money flows into Taxable funds. During the week ending January 29th, flows into Short and Intermediate IG bond funds was $1.34 billion. This follows a week with $914.8 million of positive flows recorded. For the month, total flows came in at $5.24 billion. While this isn’t the most robust start to a January for IG fund flows, it does still represent continued interest and demand by investors. High Yield bonds saw a positive $194.8 million inflow, as did UST funds with $2.12 billion and leveraged loan funds drawing in $1.5 billion in new flows.
Source: MMD, Bloomberg
Financial Planning Perspectives
Residency and Domicile: What’s the Difference and Why the Taxing Authorities Care?
Client discussions concerning the possibility of moving out of high tax states or states with an estate tax are common. Given the nature of these concerns, especially as they ponder retirement, a review of what many clients and taxing authorities are considering is topical. Given the revenue ramifications of outmigration from certain higher tax states, taxing authorities are active in ensuring that their former residents have taken the appropriate measures to establish legal domicile in their new home state or country.
People move all the time whether it be for new employment opportunities, nicer weather, higher education, to be closer to family, and for tax purposes. Whatever the reason may be, if the move is motivated solely for tax purposes, beware!
The difference between residency and domicile for tax purposes can be as stark as night and day. Domicile, according to Merriam-Webster, is “a person’s fixed permanent and principal home for legal purposes.” Residency is defined as “the act or fact of dwelling in a place for some time.” These two terms are often used interchangeably but may have a big impact for tax purposes. While a person may have three homes and reside for a period of time in each over the course of the year, only one location can be used for domiciliary purposes. In Massachusetts, the Massachusetts Department of Revenue (MDOR) concludes that your domicile (or legal residence) is your true home or main residence. We have had many client discussions where a client asserts that they will “claim domicile” in a particular tax friendly jurisdiction (often NH or FL, where they have a second home). It is our obligation to point out (as does the MDOR) that one cannot simply claim legal residency for living purposes in one state and another state for tax purposes. Massachusetts applies the following rules when determining a domicile or a change in domicile:
- Each person has a domicile and it can be their domicile of origin (where the person was born), domicile by operation of law, or domicile of choice (done by changing residency);
- Each person keeps their domicile until they establish a new domicile in a different place;
- A new domicile may be acquired only by abandoning the current domicile, establishing residence in a new place, and intending to make the new residence home permanently or for an indefinite time with no certain, present intention to return to the previous home; and
- The burden of proving that a taxpayer has changed their domicile lies with the party asserting the change (emphasis added). * See MDOR
Each state has its own set of factors that determine whether or not a taxpayer has properly taken up domicile in another place. When residents change their domicile, states often review the following types of taxpayer information:
- Did the taxpayer purchase a new home or lease an apartment in the new location;
- Did the taxpayer move their personal belongs to the new location; and complete change of address forms
- Did the taxpayer update their voter registration in the new location;
- Did the taxpayer register their auto and obtain a new driver’s license in the new location;
- Did the taxpayer update their membership in churches, clubs, and other civic organizations;
- Did the taxpayer change service providers- doctors, CPA, lawyer, investment advisor?
Since the burden of proof to determine whether or not an individual’s domicile has legally changed lies with the taxpayer, tax authorities can easily challenge an individual’s assertion that they have changed their domicile. Be mindful that if you are looking to change jurisdiction for tax purposes, it may take a great deal more than simply being out of the Commonwealth of Massachusetts for more than 183 days. For more information, please see: https://www.mass.gov/info-details/legal-and-residency-status-in-Massachusetts.
This commentary reflects the opinions of Appleton Partners based on information that we believe to be reliable. It is intended for informational purposes only, and not to suggest any specific performance or results, nor should it be considered investment, financial, tax or other professional advice. It is not an offer or solicitation. Views regarding the economy, securities markets or other specialized areas, like all predictors of future events, cannot be guaranteed to be accurate and may result in economic loss to the investor. While the Adviser believes the outside data sources cited to be credible, it has not independently verified the correctness of any of their inputs or calculations and, therefore, does not warranty the accuracy of any third-party sources or information. Specific securities identified and described may or may not be held in portfolios managed by the Adviser and do not represent all of the securities purchased, sold, or recommended for advisory clients. The reader should not assume that investments in the securities identified and discussed are, were or will be profitable. Any securities identified were selected for illustrative purposes only, as a vehicle for demonstrating investment analysis and decision making. Investment process, strategies, philosophies, allocations, performance composition, target characteristics and other parameters are current as of the date indicated and are subject to change without prior notice. Registration with the SEC should not be construed as an endorsement or an indicator of investment skill acumen or experience. Investments in securities are not insured, protected or guaranteed and may result in loss of income and/or principal.