Insights and Observations
Economic, Public Policy, and Fed Developments
- Nothing better underscores how year end is a symbolic and not actual change than a string of indistinguishable dreary days connecting December to January. Still, the turning of the year is a traditional time to take stock, and with that in mind we’re taking a bigger picture view than normal in our review.
- There is currently a broad consensus that the Federal Reserve will overtighten in their fight against inflation, causing a recession. And, for the bulls in the room, the strength of that consensus is maybe the best contrarian indicator for hope. However, the markets don’t really seem to believe the Fed will cause a recession. That’s a problem for valuations.
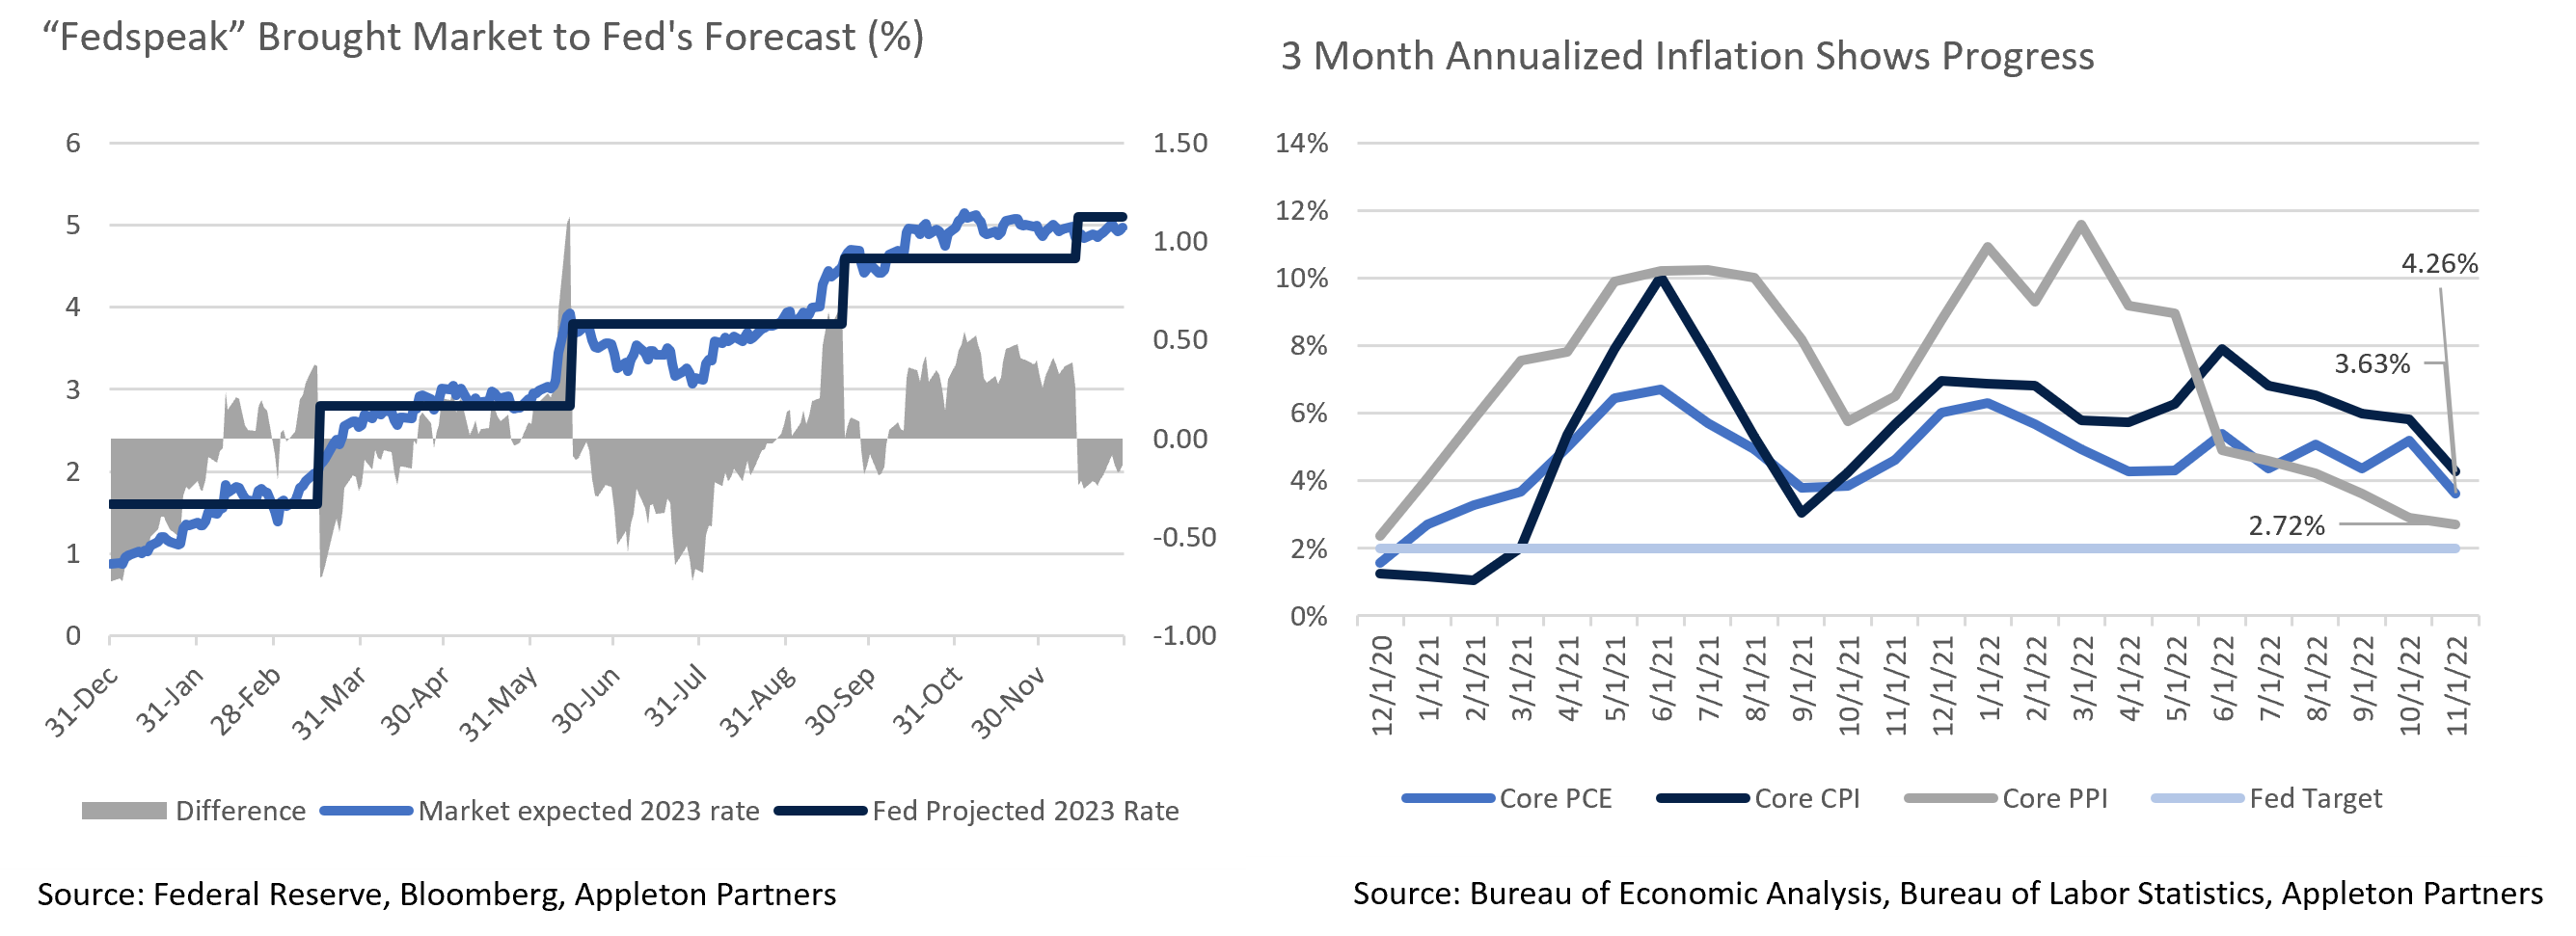
- Fed Chair Powell spent all of 2022 slowly raising the Fed’s projection of how high short-term rates would have to go. Throughout the year the market would eventually catch up with the Fed’s projection in time for them to raise it again, but rates were slow to move when the December dot plot showed the Fed expected a median 5.1% by the end of 2023. If there is any lesson this cycle it is when the Fed says they will do something, listen to them. However, right now the rates markets think the Fed will blink, a view which could be mistaken.
- Meanwhile, equity markets are pricing in consumer spending that may slow a bit but will still largely hold up. The problem here is the Federal Reserve is explicitly targeting “demand destruction,” to reduce inflation. For a while this fall, weak retail spending and consumption reports were an encouraging sign the Fed had made progress reducing demand. But, the Q3 GDP report’s final revision showed a surprise increase in personal consumption, and that initial reports had significantly understated consumer spending. This was followed closely by consumer confidence expectations indices hitting their highest readings since January. Markets are taking this as evidence the Fed is succeeding; to the Fed, strong spending is a clear sign they have not gone far enough.
- We believe three-month annualized inflation rates are the best way to control for the “base effects” that have made trailing twelve-month rates fall, overstating the Fed’s inflation-fighting progress. They show definite signs of improvement in the last several months. Nonetheless, wages are still hot, and as most salaried workers see annual adjustments in December and January, they should accelerate further. Social Security payments will also rise sharply in January. More money in consumers’ pockets almost always means more consumer spending, which in turn means there is a real risk inflation may accelerate again in the next couple months.
- All in all, the market’s 2023 outlook is based on contradictory views. Markets believe the Fed will ease its tightening earlier than they claim, consumer spending will remain robust, and even if demand does not fall in a supply-constrained economy, prices will. This is unlikely as even a “soft landing”, where only a mild slowdown tames inflation, seems like it will take further tightening. Our baseline forecast remains for the two hikes totaling 50-75bps which the market now expects. In less optimistic scenarios we think there is a real chance the Fed will ultimately hike rates higher than their latest 5.1% projection. Powell is very aware of the lessons of the 1970s and the pre-Volker era, and that too little tightening now may necessitate too much later.
- The good news is, the investment environment still looks much better than in 2022. Significantly higher carry return in fixed income is much better able to cushion additional rate hikes. We also still believe an aggressive Fed makes it more likely the peak Fed Funds Rate will occur this year, which should support equity markets as the year goes on. We just may see volatility until that time.
Equity News and Notes
A Look at the Markets
- Historically a strong month, December proved challenging for stocks this year as the major averages finished lower after back-to-back monthly gains. The S&P 500 experienced its 3rd worst December (-5.7%) since WWII and the Nasdaq suffered its worst December (-8.7%) since its 1971 inception. Every sector was lower with relative outperformance from the Utilities, Health Care, and Consumer Staples. The growth-oriented Consumer Discretionary, Technology, and Communications Services sectors were laggards.
- 2022 will go down as one of the most difficult investment environments in our lifetimes. The S&P 500 had its worst year since 2008 with a total return of -18.1%, while bonds, by any measure, had their worst year in decades. A traditional 60/40 portfolio comprised of the S&P 500 and Bloomberg Aggregate Bond Index delivered its weakest performance since 2008. Bonds have historically offered total return and a buffer against equity volatility. In last year’s rapidly rising interest rate environment, bonds fell along with equities, although today’s higher yields offer the potential for greater income and total return.
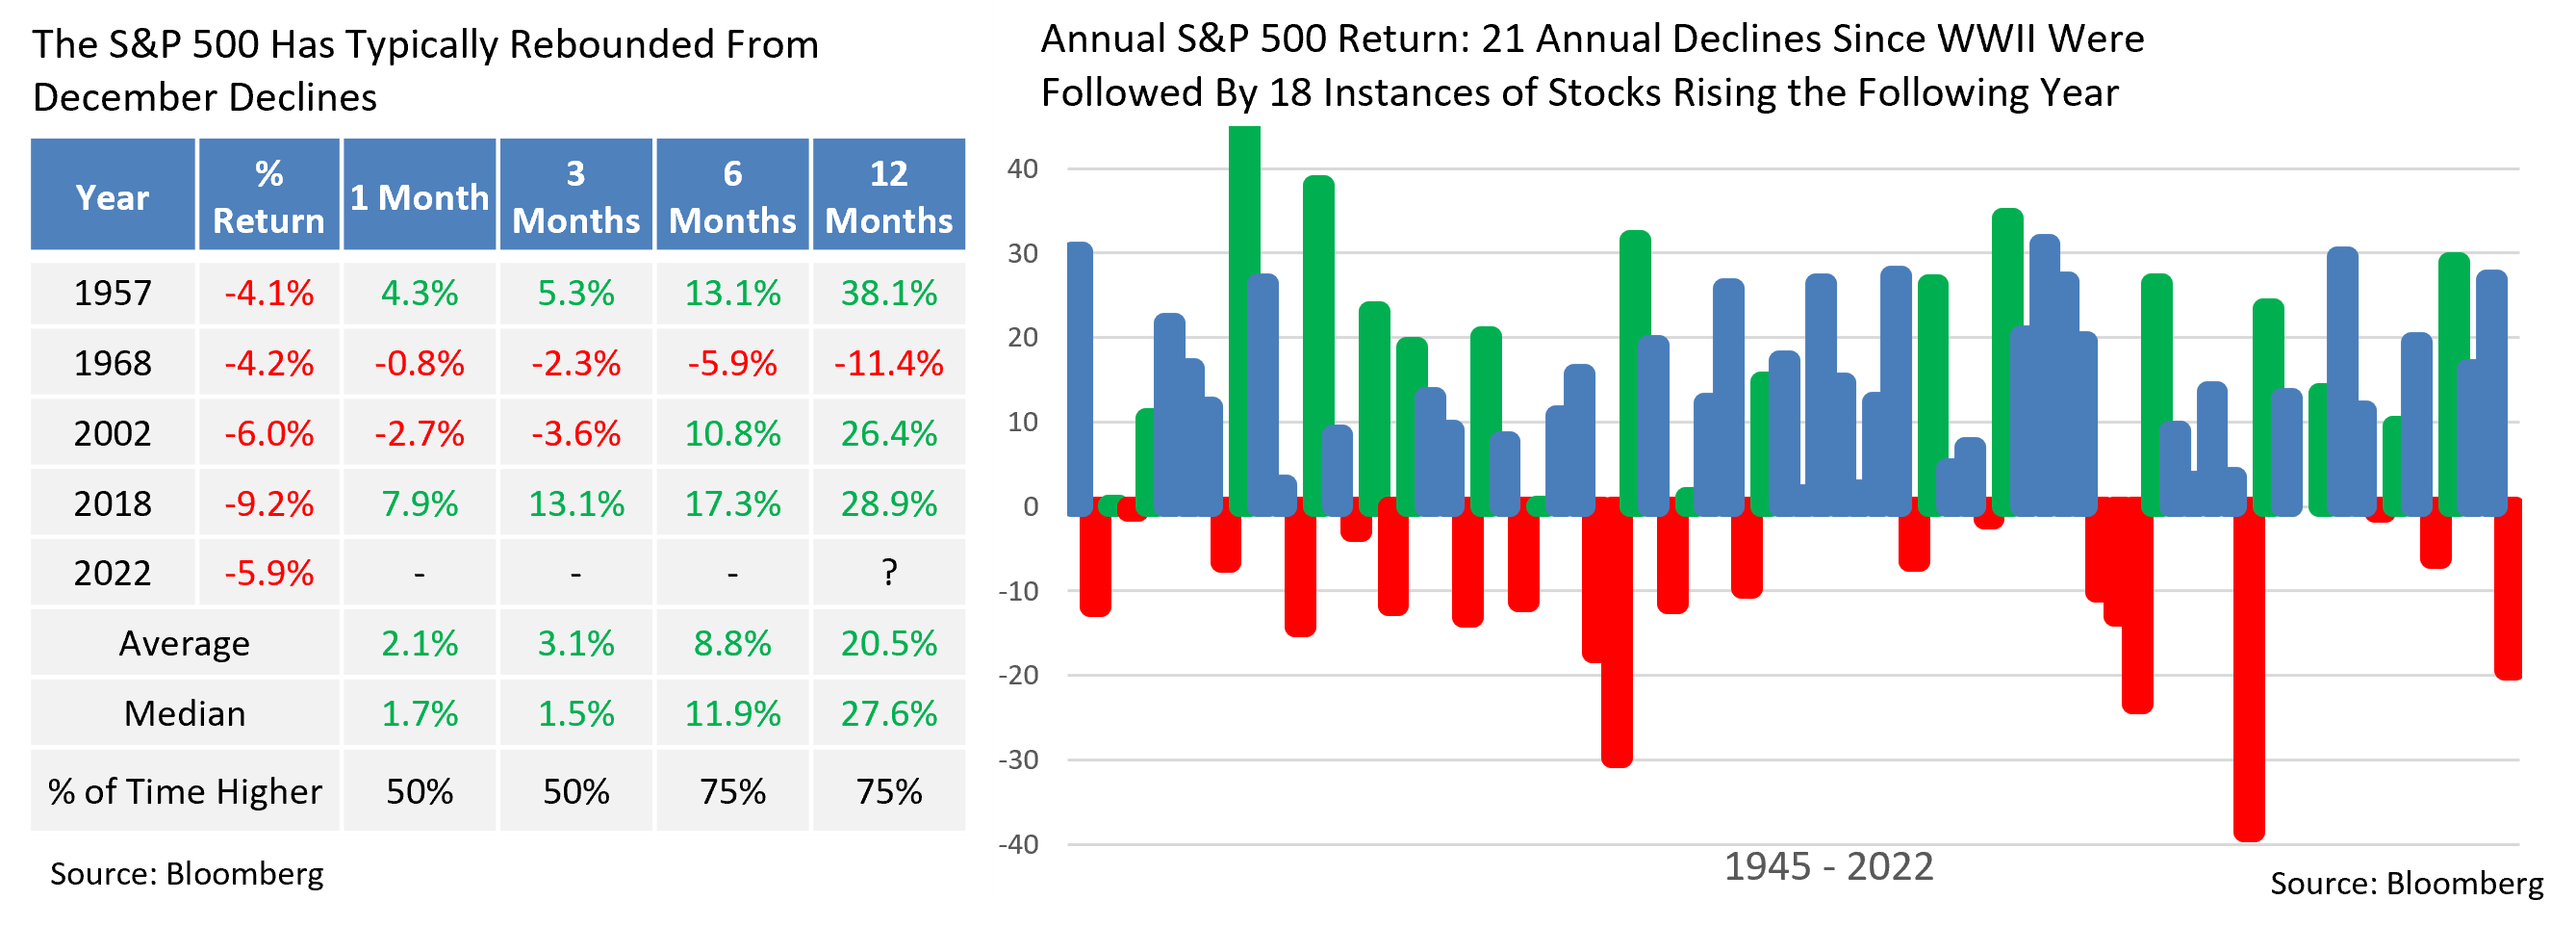
- Forecasts for 2023 are as wide ranging as the underlying potential catalysts and risks. Many observers expect a mild recession and sustained volatility in the first half leading to recovery over the last six months. No one has certainty on what tomorrow will bring, although history offers clues. First, a statistically average year for stocks is rare. Many quote long-term average S&P 500 total returns of 8-10%, although only one year dating back to 1928 actually fell within that range (1993 at +9.97%). Annual stock performance exceeds +/- 10% about 70% of the time. Second, it may give investors confidence to know that of the 21 annual declines since WWII, only 3 of those were followed by another negative year and only 3 were > -20%. The flipside is that the S&P 500 has returned > +20% in 21 of those years, more than 25% of the time. The punch line is that over many decades, stocks have had the same odds of returning >20% as they do incurring a negative year of any magnitude. Generally speaking, history is on the bulls’ side.
- The bullish and bearish narratives remain largely unchanged. Recession fears remain the largest overhang as corporate earnings will need to reset lower should the economy significantly slow. The Fed remains front and center, as financial conditions are still tightening in an effort to tame inflation. There is a disconnect between the Fed and the market when it comes to the path of rates. The Fed has signaled that it intends to raise rates to a 5-5.25% range and hold steady for 2023, whereas the market has only priced in a peak of 4.75-5% with two subsequent cuts bringing rates back to 4.5% by the end of the year. We tend to side with the market and believe the Fed will likely soften their stance later this year as inflation eases and the economy shows greater signs of strain.
- Among potential tailwinds (peak inflation, resilient consumer, tight labor market), we are monitoring the situation in China as they scrap their zero-Covid policy. A more complete Chinese economic reopening should ease supply chain concerns and ease inflationary pressures. However, the transition is unlikely to be smooth, as suspect vaccines, an older population, and fewer hospital beds represent considerable challenges. China is a large consumer of oil and copper, and an uptick in economic growth likely brings an uptick in commodity prices.
- Recognizing that the probability of a well-forecasted recession is growing, we favor a balanced approach to portfolio construction as fixed income can take on a more defensive tone and provide valuable yield. Among stocks, dividend payers and defensive sectors should fare reasonably well in the face of sustained volatility. However, we also intend to maintain exposure to high quality growth names, long-term building blocks that have become more attractive from a valuation perspective and would benefit provided inflation eases and the Fed eventually begins to pivot.
From the Trading Desk
Municipal Markets
- The municipal yield curve inverted in December, an anomaly that followed an earlier, more pronounced US Treasury inversion. Short Treasury yields have risen dramatically throughout 2022 on the back of aggressive Fed Funds rate hikes, whereas the longer end is constrained by persistent recession fears. Municipal yields typically more or less follow the Treasury curve’s lead, although perceived credit risk associated with longer maturities and certain technical factors usually prevent inversion. This year is an exception, as the spread between 2-year AAA and 5-year AAA issues stood at -8 bps at year-end, and front-end municipal curve inversion may persist until the Fed completes its tightening program.
- Further out on the curve, the greatest relative steepness has been extended to 10 to 13-year maturities. In our intermediate portfolios, at the margin we can barbell exposure in that part of the curve with much shorter maturities to maintain targeted duration while retaining a more attractive overall portfolio yield.
- Municipal/Treasury yield ratios, a common measure of relative value, are trading at low levels across the curve. Municipal supply has been highly constrained with 2022 new issuance down 19% vs. the prior year, a technical factor that has bolstered prices. New issuance and secondary market dealer inventory remains limited, and JP Morgan is projecting net negative issuance of $47 billion in 2023.
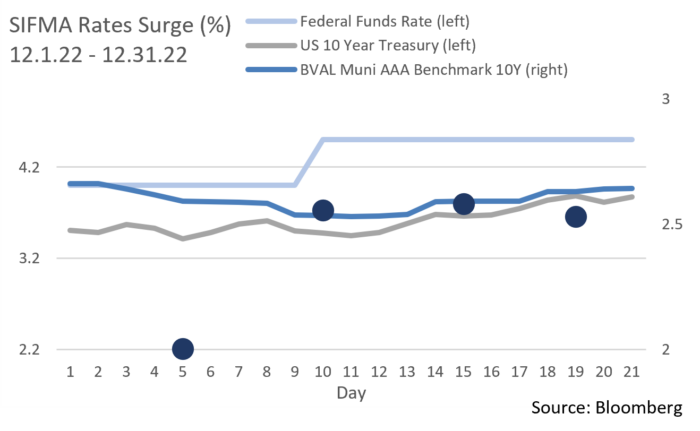
- Variable Rate Demand Notes (VRDNs), a tax-advantaged option for short-term cash, saw yields spike during December as crossover buyers abandoned the product in the face of rapidly rising Treasury yields. VRDNs are municipal instruments with coupons that reset daily or weekly, and the SIFMA Municipal Swap Index, a 7-day high grade index comprised of tax-exempt VRDN reset rates, can be volatile. Yields spiked above 3.50% towards the end of December, up from about 2.00% at the beginning of the month. As an active manager, we seek to take advantage of opportunities to enhance short-term income, and VRDNs can be compelling at certain points in times.
Corporate Bond Markets
- After reaching YTD highs in October, Investment Grade credit spreads began to tighten in the middle of October, a rally that was sustained through the close of 2022, although spreads remained steady in December. A 130 OAS print for the Bloomberg Barclays US Corporate IG Index on the last day of the year slipped just below the YTD average and helped to keep further monthly losses at bay. The Index returned -0.44% in December; the 4th best 2022 monthly return. This rally appears to be holding, and if the market’s 2023 “Fed Pivot” eventually materializes, it could be a positive for credit spreads.
- December’s primary market was very slow as issuers sat idle with limited windows of opportunity closing quickly. New supply of ~$7.5 billion was the lowest December figure since 2008. Consensus estimates of $10 – 20 billion of new debt fell well short as the typical holiday slowdown came sooner than usual. For the year, 2022 supply of ~$1.2 trillion was 16% lower than 2021, and elevated borrowing costs coupled with sustained inflation expectations have the potential to sustain pressure on the IG primary market.
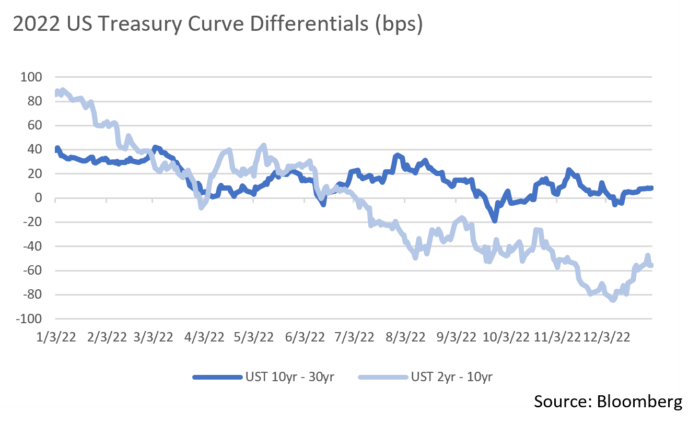
- An inverted Treasury curve that reflects a spike in short rates along with recession concerns weighing on the long end began to ease in December. A flattening trade moved yields on benchmark bonds of 5 years and longer higher by an average of 35 bps. The gap between the 2Yr and 10Yr Treasuries closed to -55bps, well off YTD highs of -85 bps. By contrast, the spread between the two maturities at the beginning of the year was +87 bps. Looking back, and in contrast with the short end of the curve, longer dated bonds of 10 to 30 years have maintained a narrower range with an average spread of +15bps. Other recent periods of inversions, most notably June and September, were not as severe. A flattening curve would likely signal a weakening economy and, should this materialize, we expect there to be some value in the 4 to 7-year maturity range.
Financial Planning Perspectives
Major Changes to the Retirement Landscape Are on the Way
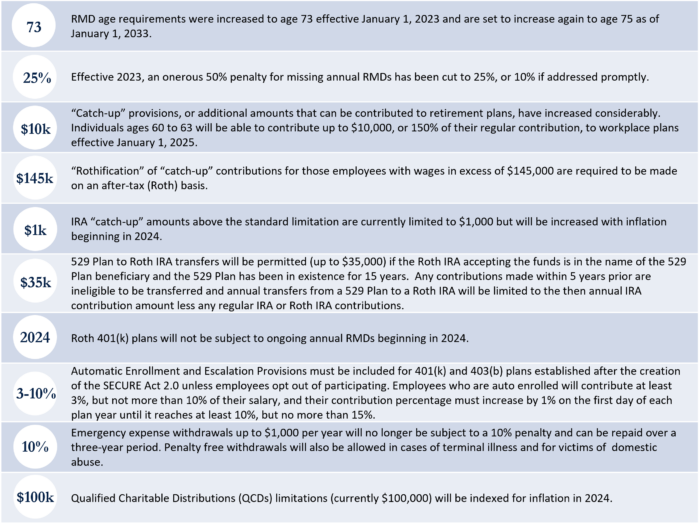
The SECURE Act 2.0, part of the massive $1.7T Consolidated Appropriations Act of 2023 signed into law on December 29, 2022, ushers in several favorable provisions designed to strengthen American retirement preparedness.
The original SECURE Act (“Setting Every Community Up for Retirement Enhancement”) was implemented in 2020 and introduced major retirement plan rule changes. Most notably, the SECURE Act increased the age of required minimum distributions (RMDs) from retirement accounts from 70 1/2 to age 72, eliminated the so-called “stretch IRA” for most non-spouse beneficiaries (requiring a 10 year pay out in most cases), and allowed employees to continue to contribute to IRAs after age 70 1/2.
The SECURE Act 2.0 has enjoyed widespread bipartisan support as Washington seeks ways to encourage increased retirement savings. In fact, the House of Representatives voted 414-5 in favor of its passage back in March 2022 and the bill was included in the recently passed expansive year-end spending package.
Major features of the newly minted legislation include:
Please speak with your Portfolio Manager about how these and other SECURE Act 2.0 provisions may impact you or your family. Everyone at Appleton Partners wishes you a safe and healthy New Year.


