Insights & Observations
Economic, Public Policy, and Fed Developments
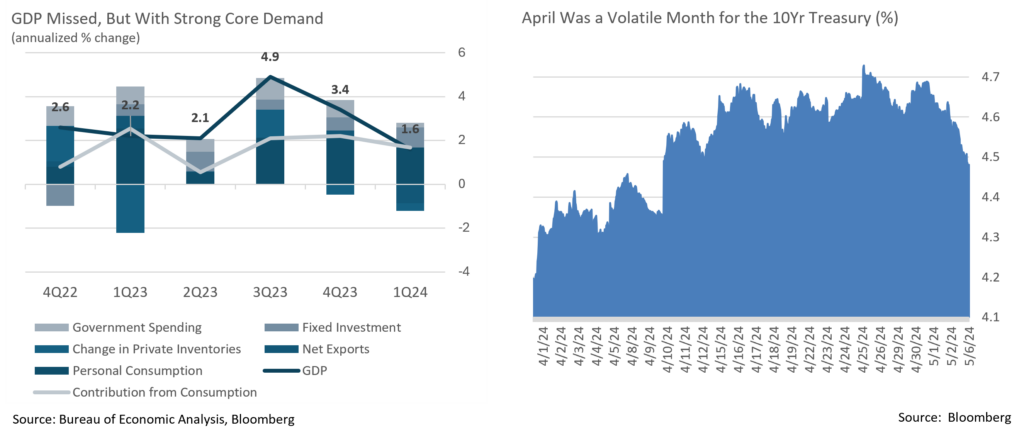
- April may have indeed been the cruelest month for rate sensitive investors, as a third consecutive strong CPI print sent Treasury yields soaring early in the month. The print wasn’t quite as bad as the market reaction indicated; at full precision, headline CPI at +0.378% and core at +0.359% were within 0.03% and 0.02%, respectively, from rounding to an in-line +0.3%. Still, after two months of higher-than-expected readings, a skittish market was primed for a sharp reaction; rates jumped more than 20bps on the news and remained elevated through month-end.
- It ended up being a month for nuanced data releases. The Q1 initial GDP report released later in the month fed investor fears of stagflation. We disagree; while the headline miss was sizeable, with a print of +1.6% vs. a consensus +2.5%, weakness was primarily due to sizable detractions from the net trade deficit (-0.86%) and from a drawdown of inventories (a further -0.35%, and we’d note inventory replenishment should now contribute to Q2 strength). Both final sales to domestic purchasers (+2.8%) and to private domestic purchasers (+3.1%) suggested significantly stronger aggregate demand than the headline number, and do not imply stagnant growth.
- The GDP price index included in the GDP report was a source of confusion, as well, surprising sharply to the upside. It’s important to remember this is a quarterly number and therefore backwards looking, and it wasn’t news to the market that inflation had been hot in the first quarter. The release of the Fed’s preferred PCE deflator (a related measure) the next day provided some validation here, and indicated the upside surprise was due to upwards revisions in January, a month we already know to have been impacted by seasonal issues. Rather than a source of new information, this was further confirmation of what we already knew, but it continued to spook a jittery market.
- Against this backdrop, Fed Chair Jerome Powell pushed back on growing fears that the Fed’s next rate move would be up and not down in his press conference on May 1st. Powell came across unexpectedly dovish, although largely by comparison to a market that had itself become very hawkish; the Fed’s “higher for longer” messaging has been remarkably consistent over the last several months. A slate of hot inflation prints has affirmed the Fed’s decision not to rush into rate cuts, while the April employment report released on May 3rd validated the Fed’s unwillingness to walk back plans for rate cuts before year-end, either. For all the market’s talk of “Fed pivots,” we see the market and not the Fed having repeatedly pivoted in 2024.
- The labor report bookended a volatile rate month by pulling yields back towards where they started. The report wasn’t weak, exactly; 175,000 new jobs in a normal month would be a solid report, and the unemployment rate at 3.9% is still low by historical norms. However, it was a sizable miss from expectations for 240k, the first such miss in some time. Coupled with a below expectation (but very normal) wage growth figure and continued slow decline in the JOLTS job openings report, it suggests a tight labor market is making progress towards normalization. Markets greeted the report by recalibrating rate cut expectations back towards the two cuts before year-end that was our base case coming into the year.

Equity News and Notes
A Look At The Markets
- Stocks fell in April as the S&P 500, Nasdaq, and DJIA all snapped 5-month winning streaks. The S&P 500 lost -4.2% to pare the YTD return to +5.6%. Nasdaq (-4.4%) and DJIA (-5.0%) modestly trailed the S&P, while small caps lagged as the Russell 2000 fell -7.1%. Ten of eleven sectors were down with Utilities (+1.6%) the lone sector in the green. REITs, which are sensitive to interest rates, were hardest hit, falling -8.6%. Neither Large Growth nor Large Value had an edge in April with both falling roughly -4.3%, although Growth maintains a healthy YTD advantage of +2.8%, driven by the strength of the “Magnificent 7.”
- A hawkish repricing of Fed rate cut expectations was the prevailing market narrative in April. Stocks were hit hard by higher-than-expected inflation prints, strong employment and wage gains, as well as a weaker initial Q1 GDP reading. These developments pushed back prospects for the onset of interest rate cuts, and projections of 3 cuts in 2024 beginning in June or July were quickly winnowed to just over 1 by late April and an implied rate only 30bps lower than current levels. UST yields were pressured as a result, with the 10Yr rising an eye-opening 48bps on the month, creating considerable headwind for equities.
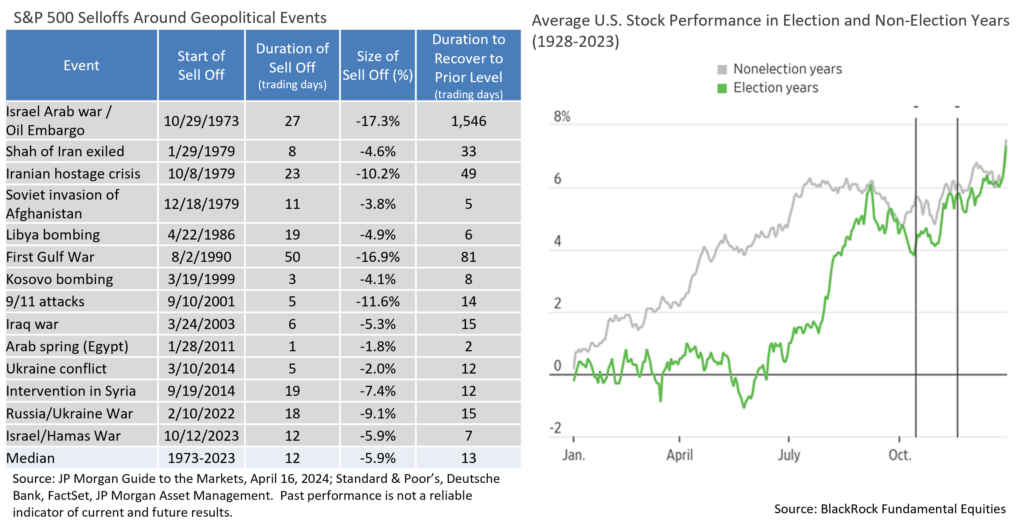
- Adding fuel to April’s risk-off theme were troubling developments in the Middle East. Markets responded by initially selling off before rallying on hopes that escalation of the war could be avoided. Despite the impact on human life and destruction of property, the market has a way of looking past geopolitical events and typically quickly recovers from short-term losses. While we remain concerned about the situation, the price action of oil, down over 10% since its peak in early April, offers some encouragement that a major escalation is likely to be averted.
- Given last month’s volatility, it is helpful to put the drawdown into perspective. The S&P 500 was on a 5-month win streak, had gained over 27% from October’s low, and returned nearly 30% for the 12 months ending March 31st, an exceptional stretch. Notably, the index has now gone over 300 trading days without a -2% day, the longest streak since 2017. While there is cause to be cautious, we contend that April’s mild volatility was a well-deserved breather, not a sign of a sustained downturn. When put through the lens of the political cycle, history suggests it is perfectly normal for the market to pause through Q2, before finding its footing as the election draws closer.
- Away from the recurring theme of Fed and monetary policy, we are encouraged by the fundamental backdrop of corporate earnings. At month’s end, 80% of companies have reported Q1 earnings and results have been good. The blended earnings growth rate is +5.0%, up from +3.4% to start the quarter, and 77% of companies have beaten expectations by an average margin of +7.5%. Net profit margins have also stabilized due largely to cost cuts and productivity gains. S&P 500 earnings growth, the most significant long-term driver of stock prices, is slated to increase +11.0% in 2024 and +9.5% in 2025. We believe these earnings targets are achievable, provided a recession is avoided and productivity remains strong. We remain constructive on stocks and expect to use meaningful pullbacks to add to positions our research team finds attractive.

From the Trading Desk
Municipal Markets
- Over the course of April 2-year AAA yields moved higher by 25bps and 10-years by 30bps, enhancing an attractive tax-exempt yield environment. Municipals subsequently rallied to begin May after a weaker than expected Nonfarm Payrolls report although yields remain in the high end of this year’s range.
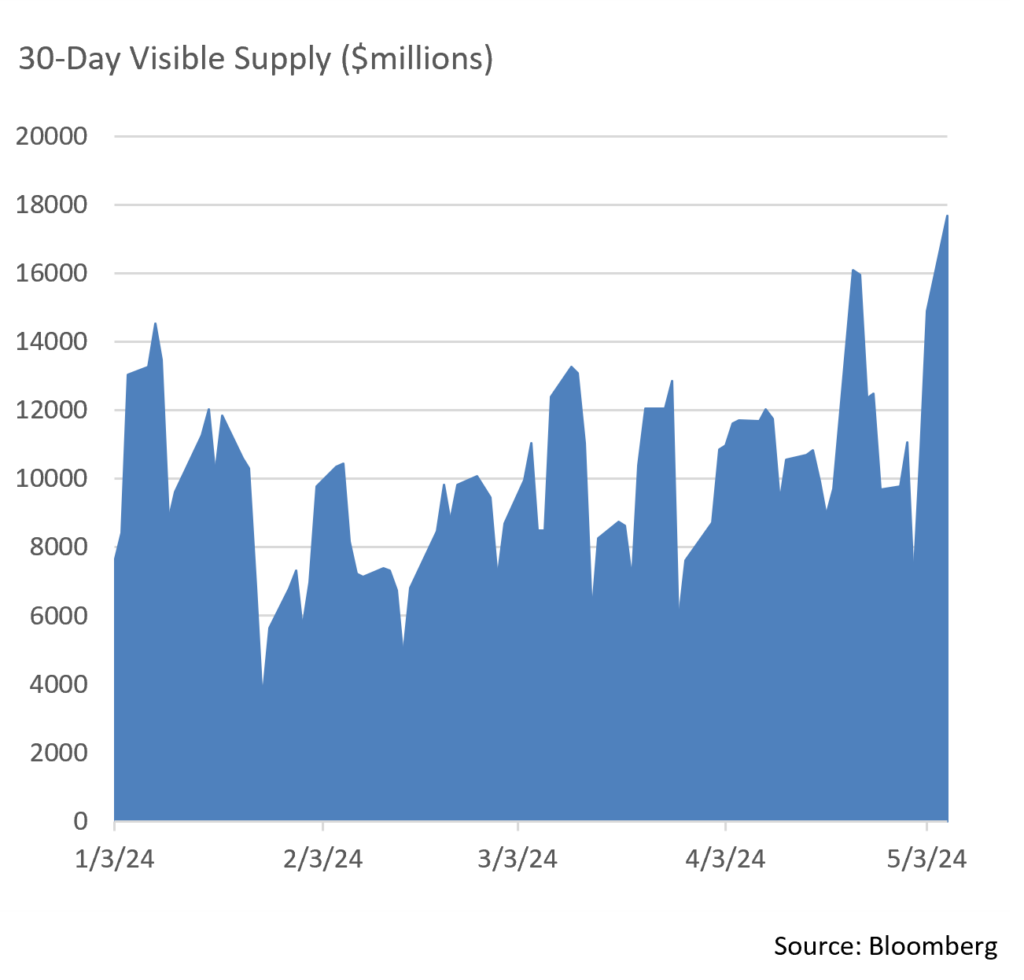
- April issuance totaled $46.35 billion according to Bloomberg, the highest issuance for that month since 2008. Increased new offering volume appears to be continuing as 30-day visible supply has now reached $17.6 billion, a high for the year, and YTD issuance is up about 30%.
- We welcome this new supply, particularly as the market approaches a period of net negative issuance. Seasonality has long impacted net municipal issuance and May through August has historically been a time when bond calls and maturities coming due exceed the availability of new supply.
- Ratios in the 10-year portion of the curve moved slightly above 60%, a level that has been difficult to break this year. Since the start of the year, the 10-year AAA/UST ratio has crept above 60% just a handful of times. We expect ratios to remain tight, especially given the approaching period of net negative issuance which is very favorable for technicals and could drive municipal yields down.

Corporate and Treasury Markets
- US Treasury rate volatility was evident in April as market participants navigated mixed economic releases and expectations for a Fed Funds rate cut. The benchmark 10Yr UST began the month at 4.31% before jumping 39bps to a YTD high of 4.70% on April 25th in the aftermath of a +3.7% Core PCE price report. This exceeded expectations of +3.4% and led investors to believe that rate cuts were being pushed further out on the horizon.
- This rate move was eerily similar to an early February spike when non-farm payroll data sharply exceeded anticipated levels. We anticipate continued pockets of volatility in a market fixated on each indication of economic growth, inflation, and Fed policy implications, although from these levels we see considerable market value.
- The Investment Grade credit markets remain resilient with OAS on the Bloomberg US Corporate Bond Index reaching a YoY low of 87bps on April 10th only to back up 6bps by mid-month. As has often been the case of late, spreads soon rallied back towards lows as investor reaction to the Core PCE number was not as magnified as in the Treasury markets. Excess returns in credit were marginally flat to slightly positive on the month, and we feel a significant breakout in IG credits spreads in the near future is unlikely given the desire of investors to lock in yields.
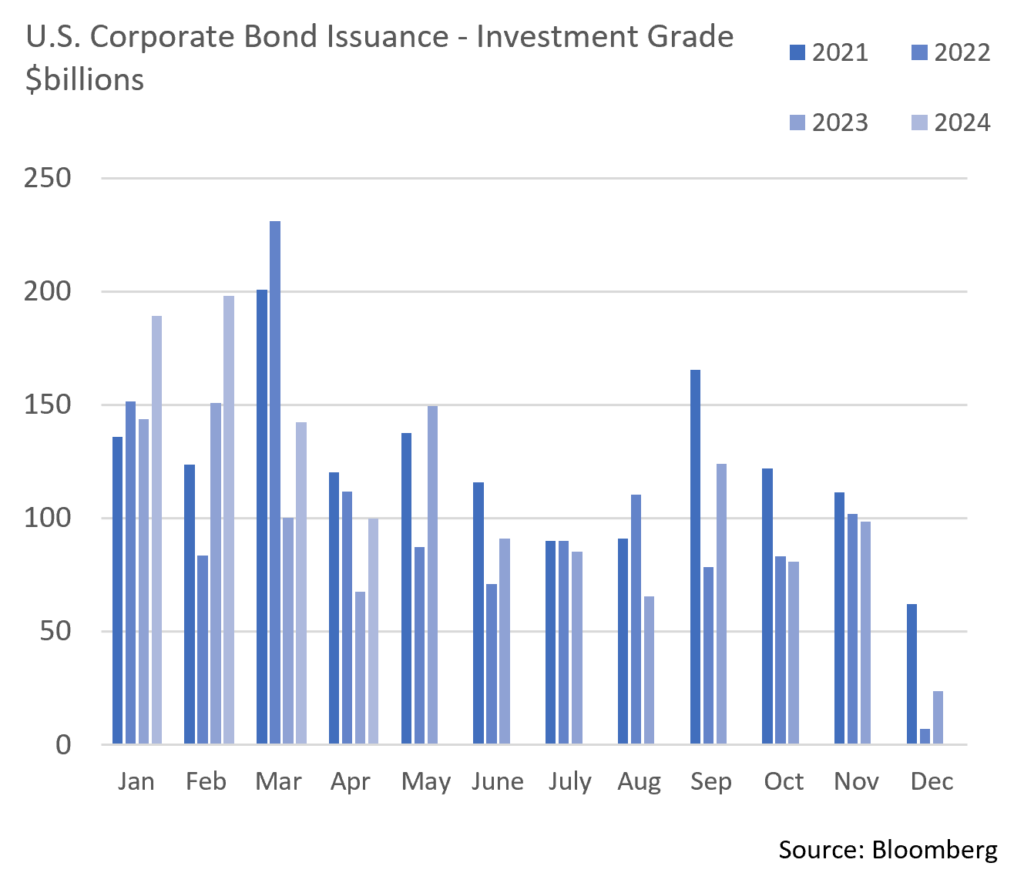
- New issuance remains healthy although there have been intermittent signs of buyer fatigue. A robust volume of new offerings during Q1 spilled over into April before cooling to $102 billion on the month. This included a jumbo-sized deal brought by Boeing, a recently downgraded issuer. In another sign of investor appetite for credit, this high-profile deal was nearly 8x oversubscribed and concessions of 3bps were quite nominal. Spreads also tightened 35 to 40bps across maturity tranches and the bonds traded very well in the secondary market.

Financial Planning Perspectives
Life Settlements and The Nature of The Underlying Process
Many of our clients have purchased life insurance policies to protect their loved ones from the potential financial impact of a premature death. Life insurance can help ensure that income is replaced, a mortgage can be paid, and that college funding is available. Various types of policies – permanent, term, variable life, among them – are all designed to provide financial protection and peace of mind.
What happens to life insurance policies that are no longer needed or become unaffordable in retirement? What options are available to policyholders? Historically, whole life policies were often tendered back to the issuing insurance carrier at stated cash value, and in the case of term insurance, the policies were allowed to lapse by the insured. Those options are less than ideal.
Enter the life settlement process, which refers to the sale of an in-force life insurance policy to a third party. This process gained steam in the 1980s and 1990s as a response to the AIDS epidemic and problems associated with viatical settlements. This refers to an arrangement whereby an individual with a terminal illness sells their life insurance policy in order to meet financial needs while they are still alive. Life settlement subsequently developed, the major difference being that one does not have to be terminally ill to sell their insurance policy. Furthermore, in response to viatical settlement abuses, the life settlement industry is highly regulated.
Life settlement is a transaction whereby the insured sells their subject policy in exchange for an immediate cash payment, or a combination of cash and/or reduced insurance coverage. Upon the sale of the policy, the third party assumes premium payments and eventually collects the death benefit upon the passing of the insured. Life settlements are entered into by a wide variety of entities and many buyers see this as an uncorrelated, reasonably predictable investment. In essence, the third-party purchaser is assessing an insured’s life expectancy, the cost of ongoing premiums, and, ultimately, the death benefit.
If you are considering a life settlement transaction, it is extremely important to carefully consider the advantages and disadvantages of the agreement. A significant benefit would be receiving a higher cash payment than simply exchanging a policy for its cash value, as well as reducing or eliminating premiums. An obvious downside is the named beneficiary losing the insured’s death benefit. Additionally, any gains on the transaction introduce tax ramifications.
Another consideration is what type of entity you would be selling to. Many firms purchase policies to be held as balance sheet investments. However, going direct to a single purchaser may limit a sale’s value. Today, brokers also auction policies through a competitive bidding process that can increase sale proceeds. However, before engaging a broker, consider whether they are a fiduciary representing your interests, or those of a third-party investor.
The rising popularity of life settlements has produced many late-night commercials offering to purchase policies. According to these commercials, selling your policy is easy and straightforward. Realistically, that may not be the case and Appleton can assist in determining whether life settlement is appropriate for you and your family.
Life Insurance Settlement Association
https://www.lisa.org/why_life_settlements
At Appleton, we take great pride in the wealth management and financial planning services provided to our clients. Is there someone you care about who might benefit from working with us, but you’re unsure how to make the introduction?If so, please let us know. We are happy to help.
Please contact your Portfolio Manager or reach out to Jim O’Neil, Managing Director.
617-338-0700 x775 | [email protected] | www.appletonpartners.com
This commentary reflects the opinions of Appleton Partners based on information that we believe to be reliable. It is intended for informational purposes only, and not to suggest any specific performance or results, nor should it be considered investment, financial, tax or other professional advice. It is not an offer or solicitation. Views regarding the economy, securities markets or other specialized areas, like all predictors of future events, cannot be guaranteed to be accurate and may result in economic loss to the investor. While the Adviser believes the outside data sources cited to be credible, it has not independently verified the correctness of any of their inputs or calculations and, therefore, does not warranty the accuracy of any third-party sources or information. Specific securities identified and described may or may not be held in portfolios managed by the Adviser and do not represent all of the securities purchased, sold, or recommended for advisory clients. The reader should not assume that investments in the securities identified and discussed are, were or will be profitable. Any securities identified were selected for illustrative purposes only, as a vehicle for demonstrating investment analysis and decision making. Investment process, strategies, philosophies, allocations, performance composition, target characteristics and other parameters are current as of the date indicated and are subject to change without prior notice. Registration with the SEC should not be construed as an endorsement or an indicator of investment skill acumen or experience. Investments in securities are not insured, protected or guaranteed and may result in loss of income and/or principal.


